 Global| Aug 10 2005
Mortgage Applications Down With Less Refinancing
by:Tom Moeller
|in:Economy in Brief
Summary
Total mortgage applications fell last week for the sixth decline in the last eight weeks according to the Mortgage Bankers Association. The 0.9% w/w decline lowered the starting level in August 5.8% below July which fell 1.4% from [...]
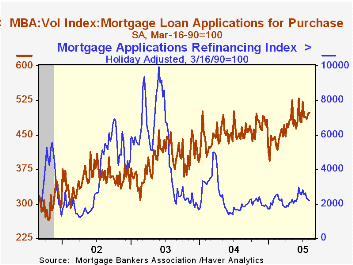
Total mortgage applications fell last week for the sixth decline in the last eight weeks according to the Mortgage Bankers Association. The 0.9% w/w decline lowered the starting level in August 5.8% below July which fell 1.4% from June.
Mortgage applications to refinance continued to decline as interest rates moved higher. The 3.3% w/w decline was the sixth in the last eight weeks and it lowered refi's 26.7% from the peak in early June.
During that period, the effective interest rate on a conventional 30-year mortgage rose to 6.16% from 5.87%. The effective rate on a 15-year mortgage also rose to 5.81%.
Purchase applications nevertheless continued to strengthen. Last week a 0.9% w/w gain lifted the starting level in August 0.6% above the July average which rose 0.9% versus June. During the last ten years there has been a 49% correlation between the y/y change in purchase applications and the change in new plus existing single family home sales.
The Mortgage Bankers Association surveys between 20 to 35 of the top lenders in the U.S. housing industry to derive its refinance, purchase and market indexes. The weekly survey accounts for more than 40% of all applications processed each week by mortgage lenders. Visit the Mortgage Bankers Association site here.
Monetary Policy and Asset Price Bubbles from the Federal Reserve Bank of San Francisco is available here.
| MBA Mortgage Applications (3/16/90=100) | 08/05/05 | 07/29/05 | Y/Y | 2004 | 2003 | 2002 |
|---|---|---|---|---|---|---|
| Total Market Index | 745.0 | 752.1 | 20.9% | 735.1 | 1,067.9 | 799.7 |
| Purchase | 498.8 | 494.5 | 13.4% | 454.5 | 395.1 | 354.7 |
| Refinancing | 2,176.5 | 2,250.3 | 32.7% | 2,366.8 | 4,981.8 | 3,388.0 |
by Carol Stone August 10, 2005
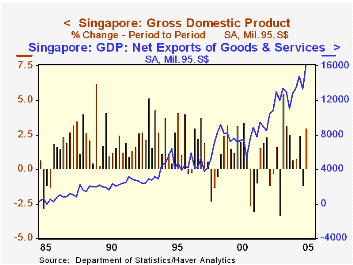
Singapore produces, refines and exports oil. Oil supports growth. But it may also make for a more volatile economy than a country with greater diversity. In Q2, Singapore's real GDP grew 3.0%, following a 1.2% decrease in Q1, and a gain of 5.2% since the year-ago quarter. Growth in 2004 was a strong 8.4%, with domestic spending sectors also running at just about that pace. Private consumption was up 2.1% in the latest quarter, but only 2.3% during the last year, a considerable moderation from 2004's 8.6% surge. Investment, called here "GFCF" -- Gross Fixed Capital Formation -- is similarly erratic, up in Q2, but otherwise tracing a zigzag pattern. Consumption has absorbed a fairly steady 42% of GDP in the last several years, but investment outlays have drifted down to 24% by Q2, a record low in the 30-year-long history of the Singapore national accounts.
Net exports, by contrast, are gaining. Five years ago, they were 18% of real GDP, and in Q2 2005, they were 34% of the total. Similarly, in current prices, oil exports were 13.6% of GDP five years ago, and in Q2, they were 27.5%, slightly more than twice as large a share. 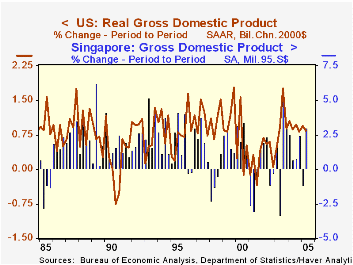
So what about this volatility? In the second graph, we see clearly that Singapore's GDP growth is both stronger and more erratic than that of the US, as indicated by a simple average of quarterly growth rates over a long span of years and the standard deviation accompanying them. Since the US is hardly representative of the world at large, we checked several other countries. The same holds for a diverse group including France, Australia and the Czech Republic: slower but steadier growth than Singapore. South Korea, which does not produce oil for export, nonetheless has as much growth and as much volatility as Singapore. Russia, an oil producer, has seen average quarterly growth similar to the US, but volatility higher than any other of these nations. Clearly the structures of all these economies are far more complex than our simple comparison here, but our result does suggest that reliance on oil can make for unsteady economic performance.
| Singapore | Q2 2005 | Q1 2005 | Q2 2004 | 2004 | 2003 | 2002 |
|---|---|---|---|---|---|---|
| Real GDP | 3.0% | -1.2% | 5.2% | 8.4% | 2.5% | 3.0% |
| Private Consumption | 2.1% | -0.1% | 2.3% | 8.6% | 1.2% | 5.0% |
| GFCF | 1.2% | -1.0% | -4.5% | 8.5% | -5.5% | -8.5% |
| Current Account | S$15.3 | S$12.1 | S$10.7 | S$47.1 | S$47.0 | S$33.8 |
| Exports: Goods (current prices) | 9.9% | -6.2% | 11.4% | 20.8% | 12.3% | 10.2% |
| Imports: Goods (current prices) | 8.0% | -3.7% | 9.8% | 23.7% | 7.9% | 7.0% |

Tom Moeller
AuthorMore in Author Profile »Prior to joining Haver Analytics in 2000, Mr. Moeller worked as the Economist at Chancellor Capital Management from 1985 to 1999. There, he developed comprehensive economic forecasts and interpreted economic data for equity and fixed income portfolio managers. Also at Chancellor, Mr. Moeller worked as an equity analyst and was responsible for researching and rating companies in the economically sensitive automobile and housing industries for investment in Chancellor’s equity portfolio. Prior to joining Chancellor, Mr. Moeller was an Economist at Citibank from 1979 to 1984. He also analyzed pricing behavior in the metals industry for the Council on Wage and Price Stability in Washington, D.C. In 1999, Mr. Moeller received the award for most accurate forecast from the Forecasters' Club of New York. From 1990 to 1992 he was President of the New York Association for Business Economists. Mr. Moeller earned an M.B.A. in Finance from Fordham University, where he graduated in 1987. He holds a Bachelor of Arts in Economics from George Washington University.
More Economy in Brief


