 Global| Jun 21 2006
Mortgage Applications Dip, # of Unsold Homes Soar
by:Tom Moeller
|in:Economy in Brief
Summary
The total number of mortgage applications dipped 0.8% last week after the 7.0% recovery the prior week. Through early June, applications were just 0.6% below the May average but were 27.9% below the year ago level. Applications to [...]
The total number of mortgage applications dipped 0.8% last week after the 7.0% recovery the prior week. Through early June, applications were just 0.6% below the May average but were 27.9% below the year ago level.
Applications to refinance fell 2.2% last week following the 10.6% surge during the week prior. Refis in June were 1.7% below the May average and 43.1% below the year earlier level.
Purchase applications were unchanged from the prior week of the heels of a 4.8% jump. As a result purchase applications in early June were about even with the May average, but were 13.5% below the year ago level.
During the last ten years there has been a negative 80% correlation between 30-year mortgage interest rates and purchase applications while during those years there has been a 54% correlation between the y/y change in purchase applications and the change in new plus existing single family home sales.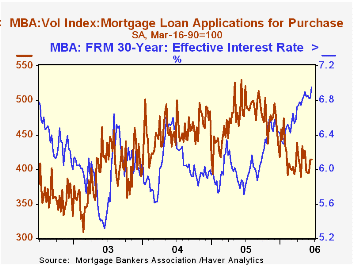
The effective interest rate on a conventional 30-year mortgage increased thirteen basis points to 6.96%. The rate on 15-year financing also rose ten basis points to 6.65%, its highest since April 2002. Interest rates on 15 and 30 year mortgages are closely correlated (>90%) with the rate on 10 year Treasury securities and during the last ten years there has been a (negative) 82% correlation between purchase applications and the effective rate on a 30-Year mortgage.
The Mortgage Bankers Association surveys between 20 to 35 of the top lenders in the U.S. housing industry to derive its refinance, purchase and market indexes. The weekly survey accounts for more than 40% of all applications processed each week by mortgage lenders. Visit the Mortgage Bankers Association site here.
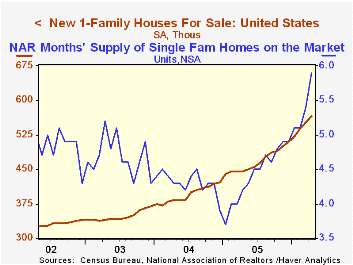
During 2006 sales of new single family homes have fallen 11.5% from the average level during 2005, a decline very much heralded by what has been an 11.7% drop in purchase applications this year versus last year's average. But construction starts so far in 2006 are down only 2.5% from the 2005 average.
The mismatch between the decline in sales and the decline in starts has resulted in a 15% rise in the number of new single family houses for sale YTD vs. the 2005 average. Measuring the increase in unsold new homes y/y results in a 27.0% increase. Increases by region y/y break down as follows: Northeast, +63.6%; South, +36.5%; West, +26.7%; Midwest, -3.6%. These figures are available in Haver's USECON database.
The inventory of unsold existing single family homes has risen a slightly faster 33.2% y/y. Year to date that inventory is up 11.2% and the months' supply on the market is 5.9 times the current sales rate, versus 3.7 times in early 2005.
Adjusting to the Next Stage of the Housing Cycle is a recent speech by Atlanta Federal Reserve Bank President Jack Guynn and it can be found here.
| MBA Mortgage Applications (3/16/90=100) | 06/16/06 | 06/09/06 | Y/Y | 2005 | 2004 | 2003 |
|---|---|---|---|---|---|---|
| Total Market Index | 567.6 | 571.9 | -27.9% | 708.6 | 735.1 | 1,067.9 |
| Purchase | 414.8 | 414.6 | -13.5% | 470.9 | 454.5 | 395.1 |
| Refinancing | 1,466.1 | 1,499.4 | -43.1% | 2,092.3 | 2,366.8 | 4,981.8 |
by Carol Stone June 21, 2006
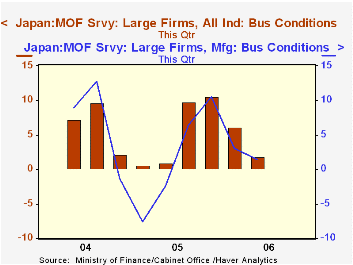
The recently instituted business survey by Japan's Ministry of Finance showed a distinct slowing in its second quarter results, reported today. The survey is just two years old, so there is obviously not much history. But these results hardly seem surprising with energy prices remaining high, and the Bank of Japan widely expected to engineer an increase in interest rates in the weeks ahead. 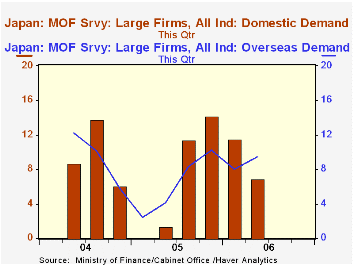
The overall "business conditions" gauge dropped from 6.1% (balance, favorable less unfavorable) in Q1 to 1.8% in Q2. It had already retreated from 10.5% in Q4/2005. In the manufacturing sector, business conditions eased this quarter to 1.4% from 3.1% last period.
In Q2, the responding firms assessed "overseas demand" as stronger than "domestic demand". The domestic sector was rated positively for Q2 at a net +6.9% of firms, while overseas demand conditions stood at +9.5%. However, for the prior couple of quarters, the opposite was the case, as domestic activity was positive by double-digit amounts and higher than ratings on the foreign sector by 3 to 4 points. 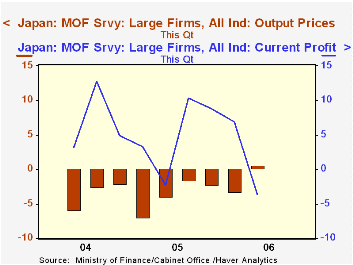
There is a hint in some of the associated detail, particularly sales, that Q2 may be subject to some seasonality; after companies rush to do business in the final quarter of their fiscal year, Q1 in Japan, the next quarter is something of a letdown. With so little history here, it's premature to make a conclusion about that, but it may help explain the Q2 slowdown.
Meantime, one other aspect of the survey results really stood out. For the first time in this survey, selling prices had a positive reading. It's only +0.6%, but even so, it is still another sign that the deflationary period in Japan may have ended.Nonetheless, rising costs took a greater toll on profits, so after a couple of favorable quarters in that item, it dipped back into negative territory.
| JAPAN: Large Firms, % Balance |
Q2 2006 | Q1 2006 | Q4 2006 | Q2 2005 | Q2 2004 |
|---|---|---|---|---|---|
| Business Conditions | 1.8 | 6.1 | 10.5 | 0.9 | 7.2 |
| Manufacturing | 1.4 | 3.1 | 10.5 | -2.4 | 8.9 |
| Domestic Demand | 6.9 | 11.5 | 14.2 | 1.4 | 8.7 |
| Overseas Demand | 9.5 | 8.0 | 10.2 | 4.1 | 12.2 |
| Selling Prices | 0.6 | -3.2 | -2.2 | -3.9 | -5.8 |
by Tom Moeller June 21, 2006
Gold prices at $567.00 per ounce yesterday were more than 20% lower than their high during May. (Since 1980 there has been a 56% correlation between the level of gold prices and the y/y change in consumer prices.)
In addition, the price of WTI crude oil at $68.94 per barrel is off 8% from the May high. These declines, however, seem more attributable to an easing of political tensions (Iran) than to some bona fide drop in inflation pressure. Measured price inflation is up, industrial commodity price inflation is up, inflation expectations are higher as well.
Consumer prices YTD have risen at a 5.2% annual rate in 2006 versus last year's 3.4% gain. The 3.1% rate of advance in "core" consumer price inflation is up from 3.3% growth last year, the 3.8% gain in core services prices is up one percentage point from last year and even the soft 1.2% rise in core goods prices is up from 0.5%.
The JoC-ECRI Industrial Metals Prices Index is up 25.2% this year due to higher prices for aluminum (up 35.4%), copper scrap (up 65.5%) and stainless steel scrap (up 17.6%). High grade copper prices have eased quite a bit from the earlier high but remain up 44.1% since year end '05.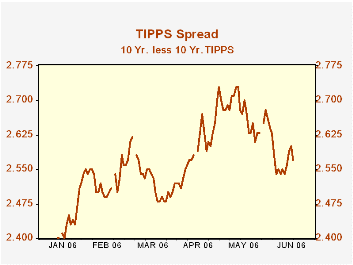
Growth in industrial production is behind these gains. U.S. output gains have wobbled in recent months but factory production is up at a 3.9% annual rate this year, the same rate growth as during all of 2005. Output in the OECD Major Seven countries also is firm at 3.2% y/y through March. That's comparable to growth during the prior three years but quite the improvement from a range of 0.8% to -3.0% during 2001-2003. During the last ten years there has been a 49% correlation between the level of industrial metals' prices and the y/y change in OECD Big Seven industrial production.
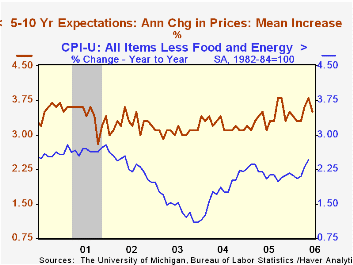
Inflation expectations as measured in the University of Michigan survey slipped from the highs in the June survey but the trend is clearly up. And in the market for Treasury securities, the so called TIPPS spread is down as well, but the trend remains elevated.
The Fed's Inflation Objective from the Federal Reserve Bank of St. Louis can be found here.
| Weekly Prices | 06/20/06 | 12/27/05 | Y/Y | 2005 | 2004 | 2003 |
|---|---|---|---|---|---|---|
| Light Sweet Crude Oil, WTI (per bbl.) | $68.94 | $58.16 | 21.1% | $58.16 | $41.78 | $32.78 |
| U.S. Retail Gasoline (per gallon) | $2.87 | $2.20 | 32.9% | $2.27 | $1.85 | $1.56 |
| Gold: Handy & Harmon (per Troy Oz., EOP) | $567.00 | $507.40 | 30.3% | $507.40 | $443.40 | $416.25 |
| High Grade Copper (Comex, /Lb., EOP) | $3.29 | $2.28 | 94.9% | $2.28 | $1.54 | $1.04 |
| Stainless Steel Scrap (/ton, EOP) | $2,158 | $1,268 | 30.2% | $1,268 | $1,558 | $1,265 |

Tom Moeller
AuthorMore in Author Profile »Prior to joining Haver Analytics in 2000, Mr. Moeller worked as the Economist at Chancellor Capital Management from 1985 to 1999. There, he developed comprehensive economic forecasts and interpreted economic data for equity and fixed income portfolio managers. Also at Chancellor, Mr. Moeller worked as an equity analyst and was responsible for researching and rating companies in the economically sensitive automobile and housing industries for investment in Chancellor’s equity portfolio. Prior to joining Chancellor, Mr. Moeller was an Economist at Citibank from 1979 to 1984. He also analyzed pricing behavior in the metals industry for the Council on Wage and Price Stability in Washington, D.C. In 1999, Mr. Moeller received the award for most accurate forecast from the Forecasters' Club of New York. From 1990 to 1992 he was President of the New York Association for Business Economists. Mr. Moeller earned an M.B.A. in Finance from Fordham University, where he graduated in 1987. He holds a Bachelor of Arts in Economics from George Washington University.
More Economy in Brief


