 Global| Jun 09 2005
More Industrial Production: Lackluster in the UK, Trending Upward in South Africa
Summary
Industrial production picked up in the UK in April, rising 0.8%, the first increase since December. Metals, machinery, wood and paper products and electrical machinery were among the main movers in April's upturn. Beneficial to UK [...]
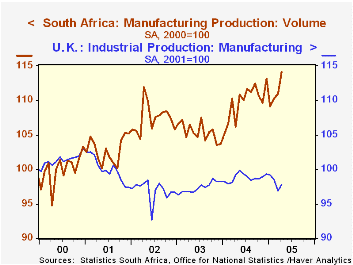
Industrial production picked up in the UK in April, rising 0.8%, the first increase since December. Metals, machinery, wood and paper products and electrical machinery were among the main movers in April's upturn. Beneficial to UK industry as this was, it still left production down 2.7% from a year ago. The manufacturing sector is also off by that amount and the mining sector, even more. Notably, among mining divisions, the energy sector has been lagging, while non-energy mining output is climbing. Year-on-year declines in the manufacturing sector are widespread, with output of textiles, paper, and electrical machinery all down at least 7%; thus, gains for all of these in April are gratifying, although that in textiles is quite small at 0.4%, month-on-month. Overall, the UK industrial sector appears hesitant, and with sluggishness in the industrial sector mirrored in employment and also most recent in a decline in new home construction starts.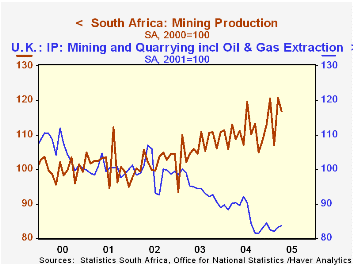
South Africa also reported April production data today. That nation's industrial activity looks much healthier, with widespread uptrends in both factory and mining sectors. Output of manufactures is up vigorously, with a 2.8% month-on-month rise in April, capping a 7.1% yearly gain. The largest increases are in food, glass, motor vehicles and furniture. South Africa's mining sector saw a monthly decrease, but trends there are generally strong, with output of nearly every major mineral well above a year ago. Copper, for instance, has seen year-to-year increases the last two months, apparently ending a long decline. "Other" metals have risen 27% and diamonds, 33.5%. Only nickel and gold show year-over-year declines. Mining represents nearly a quarter of total industry in South Africa, compared with 14% in the UK.
| Industrial Production | Apr 2005 | Mar 2005 | Year Ago | 2004 | 2003 | 2002 |
|---|---|---|---|---|---|---|
| UK Total | 0.8 | -1.0 | -2.7 | 0.5 | -0.1 | -2.5 |
| Manufacturing | 0.9 | -1.6 | -2.7 | 1.4 | 0.5 | -3.1 |
| Mining | 0.6 | 1.3 | -5.8 | -7.8 | -5.3 | -0.3 |
| South Africa | -- | -- | -- | -- | -- | -- |
| Manufacturing | 2.8 | 0.7 | 7.1 | 4.3 | -1.9 | 4.5 |
| Mining | -3.2 | 12.9 | 7.1 | 3.9 | 4.0 | 0.8 |
| Mining ex Gold | -2.0 | 15.0 | 12.6 | 7.3 | 7.2 | 0.8 |
Carol Stone, CBE
AuthorMore in Author Profile »Carol Stone, CBE came to Haver Analytics in 2003 following more than 35 years as a financial market economist at major Wall Street financial institutions, most especially Merrill Lynch and Nomura Securities. She had broad experience in analysis and forecasting of flow-of-funds accounts, the federal budget and Federal Reserve operations. At Nomura Securities, among other duties, she developed various indicator forecasting tools and edited a daily global publication produced in London and New York for readers in Tokyo. At Haver Analytics, Carol was a member of the Research Department, aiding database managers with research and documentation efforts, as well as posting commentary on select economic reports. In addition, she conducted Ways-of-the-World, a blog on economic issues for an Episcopal-Church-affiliated website, The Geranium Farm. During her career, Carol served as an officer of the Money Marketeers and the Downtown Economists Club. She had a PhD from NYU's Stern School of Business. She lived in Brooklyn, New York, and had a weekend home on Long Island.
More Economy in Brief


