 Global| Oct 26 2007
Michigan Consumer Sentiment Added To Decline in Early October
by:Tom Moeller
|in:Economy in Brief
Summary
The University of Michigan's full- month reading of consumer sentiment for October fell 3.0% to 80.9. That roughly doubled the 1.7% decline reported for early October; it followed no change in September and a huge 7.7% drop in August. [...]
The University of Michigan's full- month reading of consumer sentiment for October fell 3.0% to 80.9. That roughly doubled the 1.7% decline reported for early October; it followed no change in September and a huge 7.7% drop in August. The decline was worse than Consensus expectations, which called for the number to be unchanged from the preliminary October figure of 82.0.
Both major sub-indexes shared in the erosion. Current conditions was lowered from its preliminary value of 98.2 to 97.6 and expectations from 71.6 to 70.1.
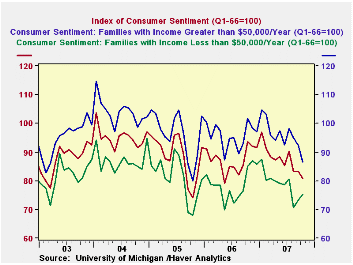
By income category, the added decline in overall sentiment reversed the early month pattern: families with greater than $50,000 per year in income had reported a reduction of -16.8% y/y, but it is now down "only" 15.1% while sentiment amongst families with income less than $50,000 per year trimmed some of its earlier m/m recovery and now shows a sizable 11.5% y/y decline.
By age group, it sentiment amongst folks in the 35-54 bracket eroded from the preliminary -17.1% y/y to -17.6%. Younger persons cut their initial assessment from +5.6% y/y to +2.3%.
Expectations about personal finances actually improved a bit from the earlier reading and are now flat with September's value; interestingly, there are now equal increases in the proportion of survey participants who expect better times ahead for themselves and in those who expect worse times. Expectations for business conditions during the next year fell for the sixth month this year out of ten. Expectations about business conditions out five years remain unattractive, with a decrease in those looking for "good times" and an increase in those expecting "bad times".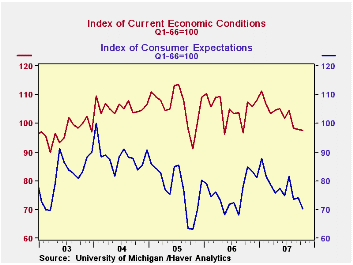
The view of the current economic conditions improved due to a slight increase in the view of current personal finances, a conclusion that is unchanged from the preliminary October survey. However, the perspective of current buying conditions turned from up slightly m/m to down slightly.
The assessment of government policy in October recovered the declines during the prior two months. This is not because more people see government doing a "good" job, but that fewer people see it doing a "poor" job; they apparently shifted to an "only fair" assessment.
The University of Michigan survey is not seasonally adjusted.The reading is based on telephone interviews with about 500 households at month-end. The summary indexes are in Haver's USECON database, with details in the proprietary UMSCA database.
Safety, Soundness, and The Evolution of U.S. Banking Industry from the Federal Reserve Bank of Atlanta can be found here.
Corporate Access to External Financing from the Federal Reserve Bank of San Francisco is available here.
| University of Michigan | October (Final) | October (Prelim.) | September | October y/y | 2006 | 2005 | 2004 |
|---|---|---|---|---|---|---|---|
| Consumer Sentiment | 80.9 | 82.0 | 83.4 | -13.6% | 87.3 | 88.5 | 95.2 |
| Current Conditions | 97.6 | 98.2 | 97.9 | -9.0% | 105.1 | 105.9 | 105.6 |
| Expectations | 70.1 | 71.6 | 74.1 | -17.3% | 75.9 | 77.4 | 88.5 |
by Tom Moeller October 26, 2007
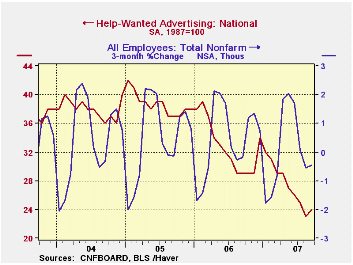
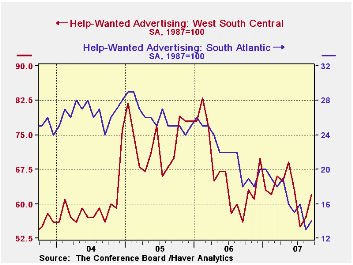
The Conference Board indicated that its index of help-wanted advertising did rise slightly last month but only to 24 from 23 in August. The figures are near the record low for the series which dates back to the 1950s.
The index had shown slight improvement during the third quarter but it has since dissipated.
During the last ten years there has been a 57% correlation between the level of help-wanted advertising and the three month change in non-farm payrolls.
The proportion of labor markets with rising want-ads improved to 57% from a low 16% in August.
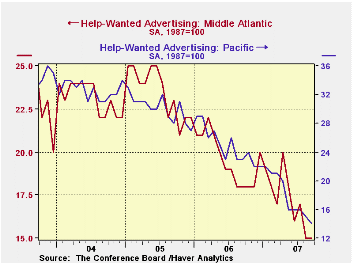
In most regions of the country the index of help-wanted advertising remained low or fell further in September with the exception of the South where moderate improvement occurred.
The Conference Board surveys help-wanted advertising volume in 51 major newspapers across the country every month.
The latest help wanted report from the Conference Board is available here.
Recent Financial Developments and the U.S. Economic Outlook also from the Federal Reserve Bank of San Francisco is available here.
| Conference Board | September | August | September 2006 |
|---|---|---|---|
| National Help Wanted Index | 24 | 23 | 29 |
by Carol Stone October 26, 2007
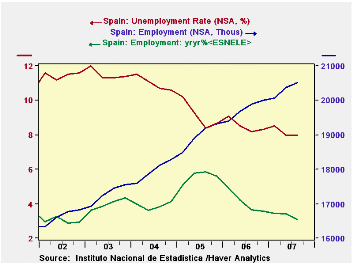
Spain's National Institute of Statistics reported Q3 labor force data today. Their formal term is "Economically Active Population Survey" or EAPS. Employment in this survey rose 143,300 from Q2 to 20.511 million workers, up 3.1% from a year ago. There were notable gains in services, up 4.2% from Q3 2006, and construction, up 4.9%. Employment in industry (mining and manufacturing) is falling off gradually and stood a 3.26 million in Q3 compared to a peak of 3.32 million in Q4 2006. That sector had shown vigorous growth from 1997 through 2003 and has been basically on a plateau since then, so the current reductions would not seem to be a sign of weakness. Construction employment, in contrast, has been growing rapidly since 1997, an average rate of 7.5%; the 4.9% in Q3 is actually the "slowest" since Q4 2005. The service sector, too, has shown vigor, with growth at nearly a 5% pace since 1995.
The Q3 unemployment rate was steady at 8.0%. There was a modest rise in the number of people unemployed, 32,000 from Q1 and 26,000 from a year ago. Unemployment has been restrained, however, in view of a notable advance in the number of economically active population. This rose 175,000 in Q3 and is up 3.0% from Q3 2006. The participation rate stands at a record 59.1% of the population over age 16, up 0.2% from Q2 and 0.7% from a year ago.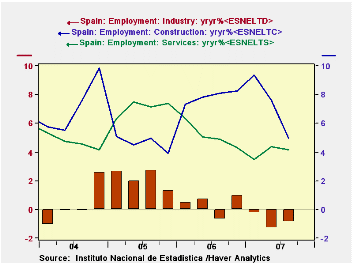
Since 2005, the Spanish labor force data have been distinctive in breaking out Spanish nationals and foreign nationals explicitly. Immigrant workers are important in many countries, and it is really worthwhile to have the Spanish statisticians compile this information. Foreign nationals constitute just under 14% of employment in Spain, 2.846 million of the total 20.511 million; their working numbers grew 328,400 in Q3 from the year earlier, 13.0%. They have a high participation rate, 76.2% in Q3, but one assumes that they come to Spain from their home country in order to seek out job opportunities. Not all are successful; their unemployment rate is 11.8%, higher than the year-ago 10.8%, but off from a recent high in Q1 of 12.6%. The participation rate among Spaniards is 57.0%; this is also up 0.2% from Q2. Their unemployment rate is 7.4%; their employment grew 286,500 over the last year, 1.6%. These series by citizenship group are too short still to do much for any precise econometric analysis, but the differential pattern of the two groups may already be helping describe forces on wages and factors that will affect the further expansion of Spanish industry and markets.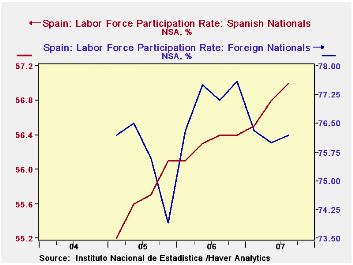
All of these data are in Haver's SPAIN database, as well as G10. The SPAIN database includes "country-sourced" data. In G10, Haver combines summary data for a number of major countries. Our analysts compile some select ratios and conduct seasonal adjustment on some series where it seems warranted. In that database, Spain's employment is seen to be up 91,600 from Q2, and the unemployment rate up 0.2% to 8.2%.
| SPAIN: "EAPS" Data, NSA | Q3 2007 | Q2 2007 | Year Ago | 2006 | 2005 | 2004 |
|---|---|---|---|---|---|---|
| Total Employment, Millions | 20.51 | 20.37 | 19.90 | 19.75 | 18.97 | 17.97 |
| Yr/Yr % Chg | 3.1 | 3.4 | 3.7 | 4.1 | 5.6 | 3.9 |
| Unemployment Rate (%) | 8.0 | 8.0 | 8.2 | 8.5 | 9.1 | 11.0 |
| Spanish Nationals, Millions | 17.66 | 17.61 | 17.38 | 17.29 | 16.90 | -- |
| Participation Rate (%) | 57.0 | 56.8 | 56.4 | 56.3 | 55.7 | -- |
| Foreign Nationals, Millions | 2.84 | 2.75 | 2.52 | 2.46 | 2.07 | -- |
| Participation Rate (%) | 76.2 | 76.0 | 77.1 | 77.1 | 75.5 | -- |

Tom Moeller
AuthorMore in Author Profile »Prior to joining Haver Analytics in 2000, Mr. Moeller worked as the Economist at Chancellor Capital Management from 1985 to 1999. There, he developed comprehensive economic forecasts and interpreted economic data for equity and fixed income portfolio managers. Also at Chancellor, Mr. Moeller worked as an equity analyst and was responsible for researching and rating companies in the economically sensitive automobile and housing industries for investment in Chancellor’s equity portfolio. Prior to joining Chancellor, Mr. Moeller was an Economist at Citibank from 1979 to 1984. He also analyzed pricing behavior in the metals industry for the Council on Wage and Price Stability in Washington, D.C. In 1999, Mr. Moeller received the award for most accurate forecast from the Forecasters' Club of New York. From 1990 to 1992 he was President of the New York Association for Business Economists. Mr. Moeller earned an M.B.A. in Finance from Fordham University, where he graduated in 1987. He holds a Bachelor of Arts in Economics from George Washington University.
More Economy in Brief


