 Global| Apr 03 2009
Market Services PMIs Turn Higher In March
Summary
In the Market PMI framework Europe is stabilizing as the rates of decline in MFG and Services bottom and begin to show some improvement. But the EU framework of surveys shows declines are still in train. The table above shows the EMU [...]
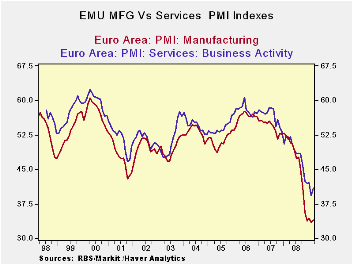
In the Market PMI framework Europe is stabilizing as the rates
of decline in MFG and Services bottom and begin to show some
improvement. But the EU framework of surveys shows declines are still
in train. The table above shows the EMU and EU EC-Commission readings
along with the Market PMI readings. They are in conflict. The EC
readings for services are mostly on their lows while the Market figures
have risen from their respective lows.
Germany, France, Italy Spain and Ireland each showed Service
sector improvement in March in the Market framework. The UK also showed
some nice improvement. All the indices are still below 50, indicating
ongoing contraction for the sector. The three-month averages are still
falling and MEU Ireland France and UK each do show current market
reading that surpass their respective three-month averages a good sign
for stability and recovery.
| NTC Services Indices for EU/EMU | |||||||
|---|---|---|---|---|---|---|---|
| Mar-09 | Feb-09 | Jan-09 | 3Mo | 6Mo | 12Mo | Percentile | |
| Euro-13 | 40.95 | 39.24 | 42.16 | 40.78 | 42.11 | 45.80 | 8.0% |
| Germany | 42.30 | 41.32 | 45.20 | 42.94 | 44.81 | 48.70 | 5.0% |
| France | 43.64 | 40.18 | 42.56 | 42.13 | 43.44 | 46.64 | 14.1% |
| Italy | 39.10 | 37.85 | 41.10 | 39.35 | 40.58 | 44.45 | 5.2% |
| Spain | 34.11 | 31.73 | 31.84 | 32.56 | 31.71 | 35.40 | 18.3% |
| Ireland | 35.69 | 31.78 | 33.94 | 33.80 | 34.03 | 38.10 | 10.8% |
| EU only | |||||||
| UK (CIPs) | 45.47 | 43.24 | 42.48 | 43.73 | 42.31 | 45.31 | 26.4% |
| US NONFMG ISM | #N/A | 41.60 | 42.90 | #N/A | #N/A | #N/A | #N/A |
| EU Commission Indices for EU and EMU | |||||||
| EU Index | Mar-09 | Feb-09 | Jan-09 | 3Mo | 6Mo | 12Mo | Percentile |
| EU Services | -31 | -29 | -28 | -32.67 | -29.50 | -23.25 | 0.0% |
| EMU | Mar-09 | Feb-09 | Jan-09 | 3Mo | 6Mo | 12Mo | Percentile |
| Services | -25 | -24 | -22 | -23.67 | -17.83 | -8.63 | 0.0% |
| Cons Confidence | -34 | -33 | -31 | -32.67 | -29.50 | -13.50 | 0.0% |
| Consumer confidence by country | |||||||
| Germany-Ccon | -31 | -29 | -27 | -29.00 | -22.67 | -14.08 | 0.0% |
| France-Ccon | -36 | -36 | -35 | -35.67 | -33.67 | -27.33 | 0.0% |
| Ital-Ccon | -31 | -28 | -26 | -28.33 | -27.33 | -25.08 | 0.0% |
| Spain-Ccon | -43 | -48 | -44 | -45.00 | -44.83 | -39.83 | 10.4% |
| UK-Ccon | -28 | -32 | -35 | -31.67 | -29.67 | -24.92 | 18.4% |
| percentile is over range since May 2000 | |||||||

Robert Brusca
AuthorMore in Author Profile »Robert A. Brusca is Chief Economist of Fact and Opinion Economics, a consulting firm he founded in Manhattan. He has been an economist on Wall Street for over 25 years. He has visited central banking and large institutional clients in over 30 countries in his career as an economist. Mr. Brusca was a Divisional Research Chief at the Federal Reserve Bank of NY (Chief of the International Financial markets Division), a Fed Watcher at Irving Trust and Chief Economist at Nikko Securities International. He is widely quoted and appears in various media. Mr. Brusca holds an MA and Ph.D. in economics from Michigan State University and a BA in Economics from the University of Michigan. His research pursues his strong interests in non aligned policy economics as well as international economics. FAO Economics’ research targets investors to assist them in making better investment decisions in stocks, bonds and in a variety of international assets. The company does not manage money and has no conflicts in giving economic advice.
More Economy in Brief


