 Global| Apr 17 2009
MAPI Survey Indicates Deepening Stress in the Factory Sector
by:Tom Moeller
|in:Economy in Brief
Summary
The manufacturing sector will remain distressed. That is the message reported yesterday in the Manufacturers Alliance/MAPI survey of the factory sector. Their composite index of activity fell to a record low level as it dropped to 21 [...]
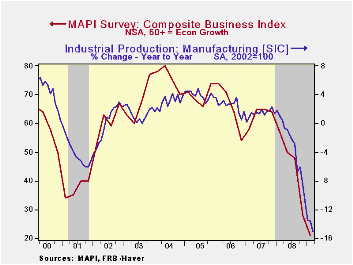
The manufacturing sector will remain distressed. That is the message reported yesterday in the Manufacturers Alliance/MAPI survey of the factory sector. Their composite index of activity fell to a record low level as it dropped to 21 from 28 in 4Q08. Both these readings were down substantially from early last year when the index stood at 57. (The figures are diffusion indexes thus any level below 50 indicates declining activity.)
The component series measuring prospective shipments fell to a record low level of 5 as only 2 percent of survey respondents expected shipments to rise. That low reading was backed up by a record low level of the orders index. It fell to 4 as only 2 percent of respondents expected higher orders. And the low level of activity is drawing down the level of order backlogs. As the index fell to a record low reading of 14 it reflected only 8 percent of respondents reporting higher unfilled orders but 80 percent reporting a lower level.
Lower factory sector activity has weighed heavily on
profitability. Fully 75 percent of respondents indicated that profit
margins fell versus early last year while just 13 percent reported a
higher reading. The overall diffusion index fell to a low 19, or
one-third the level of last year, as business activity has fallen
faster than costs. And lower profits weighed heavily capital spending.
Fully 79 percent of respondents cut spending while just 8 percent
raised it versus one year ago. The index of R&D spending
similarly fell to a record low.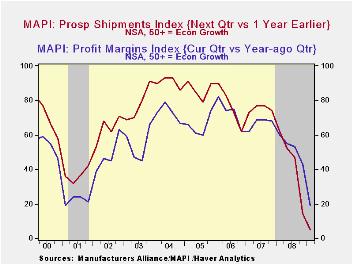
The MAPI data is not seasonally adjusted and the diffusion indexes measure activity in the current quarter versus the same quarter one year earlier. The component weights in the composite are given below in parentheses. The data can be found in Haver's SURVEYS database.
After the Crisis is yesterday's speech by Dennis P. Lockhart, President and Chief Executive Officer, Federal Reserve Bank of Atlanta and it can be found here.
| Manufacturers Alliance/MAPI Survey (NSA) | 1Q 2009 | 4Q 2008 | 1Q 2008 | 2008 | 2007 | 2006 |
|---|---|---|---|---|---|---|
| Composite Business Index | 21 | 28 | 57 | 46 | 63 | 66 |
| Prospective Shipments (0.4) | 5 | 14 | 62 | 44 | 75 | 77 |
| Backlogs Index (0.2) | 14 | 21 | 21 | 46 | 66 | 70 |
| Inventories Index (0.2) | 37 | 50 | 54 | 58 | 69 | 70 |
| Profit Margin Index (0.2 | 19 | 43 | 60 | 53 | 67 | 73 |
by Tom Moeller April 17, 2009
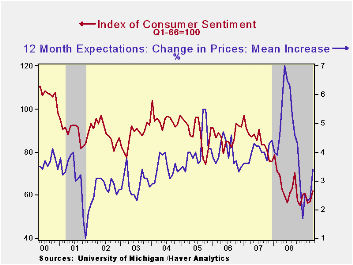
Despite higher unemployment, the University of Michigan indicated that its mid-April reading of consumer sentiment rose for a second consecutive month. In fact, the index level of 61.9 was its highest since September of last year. The improvement, however, has been just creeping. The rise from last year's low leaves it still down 20.7% from early 2008 and down by 36.1% from early 2007.
The expectations component of consumer sentiment showed the largest improvement this month with a 10.1% rise on top of the 5.9% March improvement. Expectations for business conditions during the next five years moved up by 19.0% m/m to the highest level since September (+5.6% y/y). Expected conditions during the next year rose a lesser 9.1% though the reading was a sharply from that of last spring. Finally, the higher stock market lifted the expected change in personal finances. The reading made up declines early this year with a 7.7% increase.
The current economic conditions index made up the declines of the prior two months with a 5.2% rise. Buying conditions for large household goods recouped the declines of earlier this year while the view of current personal finances remained unchanged m/m, down by one-half from early 2007.
The opinion of government policy, which may eventually
influence economic expectations, slipped m/m but remained near the
highest level since January of 2007. Twenty percent of respondents
thought that a good job was being done by government, up from the four
percent low of last December, while a much reduced thirty percent
thought that a poor job was being done.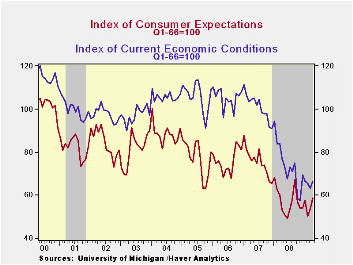
Probably reflecting the recent rise in oil prices, inflation expectations for the next year rose to 3.4% though they were as high as 7.0% last May. The median expected increase rose to 3.0% from 2.0%. The range of expectations is from slight price deflation to a 5.2% increase in prices. The expected inflation rate during the next five years reversed slipped to 2.8%.
The University of Michigan survey data is not seasonally
adjusted. The reading is based on telephone interviews with about 500
households at month-end; the mid-month results are based on about 300
interviews. The summary indexes are in Haver's USECON database
with details in the proprietary UMSCA database.
| University of Michigan | Mid-April | March | February | April y/y | 2008 | 2007 | 2006 |
|---|---|---|---|---|---|---|---|
| Consumer Sentiment | 61.9 | 57.3 | 56.3 | -1.1% | 63.8 | 85.6 | 87.3 |
| Current Conditions | 66.6 | 63.3 | 65.5 | -13.5 | 73.7 | 101.2 | 105.1 |
| Expectations | 58.9 | 53.5 | 50.5 | 10.5 | 57.3 | 75.6 | 75.9 |
by Robert Brusca April 17, 2009
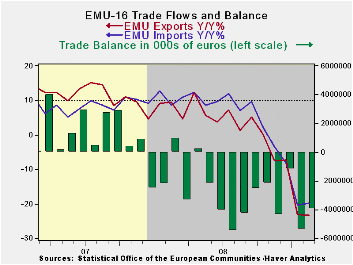
Trends are getting worse. The EMU trade deficit improved in February on a tiny rise in exports as imports continued to drop. Even though both exports and imports put in an ‘improved performance’ in February compared to January the trends in trade for exports and imports are still deteriorating and nearly in step. Export and import annual growth rates are accelerating in a downward direction as three-month growth rates show faster decline than six-month rates and six-month growth rates are declining faster than the 12-month rates. The pace of decline over three months for both exports and imports is over 40%. It is far from clear that the abatement in the pace of decline for exports and imports in February is for real. It may simply be a partial recovery from the deep decline in January.
A balanced blow. The chart shows how rapidly trade flows decelerated after September of last year. But that impact was BALANCED, hitting exports and imports nearly equally. Deficit deterioration had already reached its then-worst level in July of 2008. The slowdown is global in nature; it has hit growth within the e-Zone as well as outside of it more or less equally. Trade trends show that. The monthly growth rates show a hint of slowing. The year/year rates of growth have improved, but the sequential growth rates are still deteriorating for both exports and imports. It will take a few more months to see if we have reached low enough levels that export and imports can begin to build a base for improved future growth.
No improvement in the fundamentals. Certainly there are no economic signs
yet that point to improvement. PMI surveys have made very modest
improvements from their worst levels but even they continue to signal
contraction. Industrial production and orders continue to show sharp
deterioration. Unemployment is still rising. Retail spending remains
weak. There is no grass-roots European growth. European fiscal plans
have been less ambitious than in the US . So, there is little basis for
optimism. For now we are left to watch the trends in the trade flows
themselves.
| E- Area 16-Trade trends for goods | ||||||
|---|---|---|---|---|---|---|
| m/m% | % Saar | |||||
| Feb-09 | Jan-09 | 3M | 6M | 12M | 12M Ago | |
| Balance* | €€ (3,961) | €€ (5,356) | €€ (3,507) | €€ (3,265) | €€ 1,010 | €€ (1,119) |
| Exports | ||||||
| All Exp | 0.5% | -11.9% | -44.3% | -37.6% | -23.3% | 9.4% |
| Food and Drinks | -2.9% | -5.2% | -28.1% | -19.4% | -13.8% | 13.0% |
| Raw materials | -2.8% | -6.9% | -34.3% | -53.1% | -33.8% | 18.3% |
| Other | 0.8% | -12.5% | -45.6% | -38.4% | -23.7% | 9.0% |
| MFG | 0.7% | -12.9% | -42.6% | -37.6% | -25.2% | 7.9% |
| IMPORTS | ||||||
| All IMP | -0.8% | -8.3% | -43.9% | -36.9% | -19.8% | 8.7% |
| Food and Drinks | -0.2% | -5.7% | -18.8% | -17.3% | -9.6% | 8.4% |
| Raw materials | -5.3% | -26.2% | -81.1% | -60.8% | -35.1% | 1.3% |
| Other | -0.7% | -7.4% | -42.3% | -36.6% | -19.7% | 9.1% |
| MFG | -3.5% | -6.1% | -42.0% | -33.6% | -20.3% | -0.5% |
| *Eur mlns; mo or period average | ||||||

Tom Moeller
AuthorMore in Author Profile »Prior to joining Haver Analytics in 2000, Mr. Moeller worked as the Economist at Chancellor Capital Management from 1985 to 1999. There, he developed comprehensive economic forecasts and interpreted economic data for equity and fixed income portfolio managers. Also at Chancellor, Mr. Moeller worked as an equity analyst and was responsible for researching and rating companies in the economically sensitive automobile and housing industries for investment in Chancellor’s equity portfolio. Prior to joining Chancellor, Mr. Moeller was an Economist at Citibank from 1979 to 1984. He also analyzed pricing behavior in the metals industry for the Council on Wage and Price Stability in Washington, D.C. In 1999, Mr. Moeller received the award for most accurate forecast from the Forecasters' Club of New York. From 1990 to 1992 he was President of the New York Association for Business Economists. Mr. Moeller earned an M.B.A. in Finance from Fordham University, where he graduated in 1987. He holds a Bachelor of Arts in Economics from George Washington University.
More Economy in Brief


