 Global| Nov 06 2006
MAPI Business Outlook Survey Off FurtherĀĀ
by:Tom Moeller
|in:Economy in Brief
Summary
The 3Q '06 Composite Business Index published by the Manufacturers' Alliance/MAPI fell for the second quarter to 64 from 71 the prior quarter. The figure was at the lowest level since the second quarter of 2003. During the last ten [...]
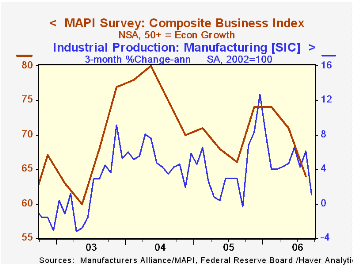
The 3Q '06 Composite Business Index published by the Manufacturers' Alliance/MAPI fell for the second quarter to 64 from 71 the prior quarter. The figure was at the lowest level since the second quarter of 2003.
During the last ten years there has been a 69% correlation between the Composite Index Level and quarterly growth in US factory sector output.
The current orders index fell to 77 from 81 in 2Q and that was the lowest since late 2003. The 3Q export orders index, however, improved moderately to 75. During the last ten years there has been a 59% correlation between the export orders index and quarterly growth in real US exports.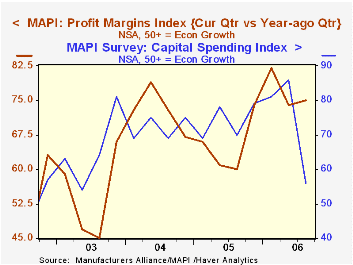
The profit margins index improved slightly to 75 from 74 in 2Q and so far in 2006 the quarters have averaged 77 versus an average 65 last year.Capital spending intentions for the coming year fell sharply 56 from the record high 86 in 2Q. During the last ten years there has been a 75% correlation between the capital spending index a q/q growth in business investment.
The survey of 60 senior financial executives representing a broad range of manufacturing industries reflects the views on current & future business conditions. The business outlook index is a weighted sum of shipments, backlogs, inventories, and profit margin indexes.
For the latest US Business Outlook from the MAPI click here.
Confessions of a Data Dependent are Dallas Federal Reserve Bank President Richard W. Fisher Remarks before the New York Association for Business Economics and they are available here.
| Manufacturers' Alliance/MAPI Survey | 3Q '06 | 2Q '06 | 3Q '05 | 2005 | 2004 | 2003 |
|---|---|---|---|---|---|---|
| Composite Business Index | 64 | 71 | 66 | 70 | 76 | 67 |
by Louise Curley November 6, 2006

September manufacturing sales and new orders for Germany were released today. Sales increased 0.17% from August but were almost 6% above September, 2005. New orders, however, fell 2.5% in September, although they were 9.6% above a year ago. The decline in new orders was attributable to foreign orders which declined 6.2% in the month. Domestic order actually increased 1.5%. Both sales and new orders--domestic and foreign--are well above year ago levels.
New orders tend to be erratic, as a result, a change in one month's orders may not be indicative. If we take a three month moving average of the data, a smoother picture emerges. The first chart compares the actual new orders with the three month moving average. The three month moving average in September shows a 1.1% gain over the August value. In the second chart, which shows domestic and foreign new orders on a three month moving average basis, foreign new orders are virtually unchanged in September and domestic orders are somewhat better.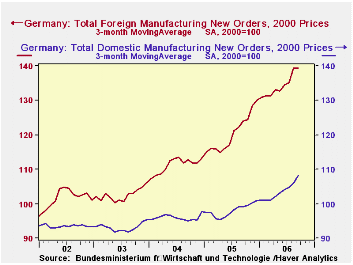
The NTC Economics Ltd's Purchasing Managers' Survey for manufacturing in German is suggesting some cooling. The diffusion indexes continue well above the 50 mark, that is indicative of increased activity, but in several indices, the October values are below the September values. The overall index for manufacturing is 58.32 for October, compared to 58.54 in September. Comparable data for the new orders index are 59.84 and 60.09; for export new orders, 56.26 and 57.09 respectively.
Deceleration in growth is not unusual after the good expansion Germany manufacturing has experienced since the beginning of 2005.
| Germany | Sep 06 | Aug 06 | Sep 05 | M/M % | Y/Y % | 2005 % | 2004 % | 2003 % |
|---|---|---|---|---|---|---|---|---|
| Manufacturing (2000=100) | ||||||||
| Sales | 115.1 | 114.9 | 108.6 | 0.17 | 5.99 | 3.27 | 3.92 | -0.48 |
| New Orders | 121.5 | 124.6 | 110.5 | -2.43 | 9.56 | 5.27 | 5.56 | 0.59 |
| Domestic | 110.3 | 108.7 | 99.5 | 1.47 | 10.85 | 2.01 | 3.11 | -0.12 |
| Foreign | 135.6 | 144.4 | 125.2 | -6.23 | 8.15 | 8.80 | 8.29 | 1.94 |
| 3 Month Moving Averages | ||||||||
| Total New Orders | 122.1 | 120.8 | 110.1 | 1.08 | 10.90 | -- | -- | -- |
| Domestic | 108.1 | 106.0 | 100.9 | 1.98 | 7.14 | -- | -- | -- |
| Foreign | 139.5 | 139.3 | 123.9 | 0.14 | 12.59 | -- | -- | -- |

Tom Moeller
AuthorMore in Author Profile »Prior to joining Haver Analytics in 2000, Mr. Moeller worked as the Economist at Chancellor Capital Management from 1985 to 1999. There, he developed comprehensive economic forecasts and interpreted economic data for equity and fixed income portfolio managers. Also at Chancellor, Mr. Moeller worked as an equity analyst and was responsible for researching and rating companies in the economically sensitive automobile and housing industries for investment in Chancellor’s equity portfolio. Prior to joining Chancellor, Mr. Moeller was an Economist at Citibank from 1979 to 1984. He also analyzed pricing behavior in the metals industry for the Council on Wage and Price Stability in Washington, D.C. In 1999, Mr. Moeller received the award for most accurate forecast from the Forecasters' Club of New York. From 1990 to 1992 he was President of the New York Association for Business Economists. Mr. Moeller earned an M.B.A. in Finance from Fordham University, where he graduated in 1987. He holds a Bachelor of Arts in Economics from George Washington University.
More Economy in Brief


