 Global| Apr 18 2005
MAPI Business Outlook Improvedаа
by:Tom Moeller
|in:Economy in Brief
Summary
The 1Q '05 Composite Business Index published by the Manufacturers' Alliance/MAPI improved slightly to 71 from 70 the prior quarter. Since 1992 there has been a 68% correlation between the Composite Index Level and quarterly growth in [...]
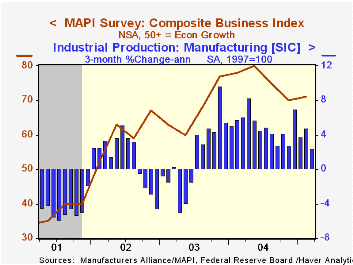
The 1Q '05 Composite Business Index published by the Manufacturers' Alliance/MAPI improved slightly to 71 from 70 the prior quarter.
Since 1992 there has been a 68% correlation between the Composite Index Level and quarterly growth in factory sector output.
The current orders index improved a point to 90. The export orders index also nudged up a point to 90, but that was a new record level.
The profit margins index slipped modestly for the second quarter but remained near a record level and capital spending intentions for the coming year fell modestly.
For the latest press release from the MAPI click here. 

| Manufacturers' Alliance/MAPI Survey | 1Q '05 | 4Q '04 | 1Q '04 | 2004 | 2003 | 2002 |
|---|---|---|---|---|---|---|
| Composite Business Index | 71 | 70 | 78 | 76 | 67 | 60 |
by Tom Moeller April 18, 2005
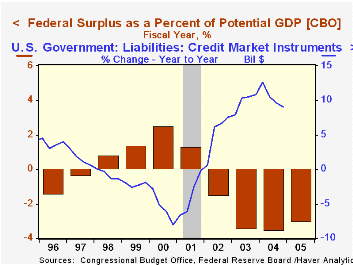
Revenues from Tax Day (April 15th) for 2005 won't be tallied for another month, but the figures for the first half of FY 2005 indicate the U.S. Federal government's budget deficit lessened just $6.8B versus the first half of FY 2004. The scant improvement is off the pace needed to meet the latest CBO projection of a $365B deficit for FY 2005.
Growth in net receipts for the first six months of FY05 improved to 10.4%, more than triple the growth during the first six months of FY04. Individual tax receipts grew 8.5% versus a 1.2% decline in the first six months of FY04 and corporate tax receipts remained on a pace which doubled the year earlier level. Reflecting the improved job market, employment taxes grew 6.5% versus 1.3% growth last year.
Offsetting the improvement in revenue growth was steady, strong growth in federal outlays, about stable at 7.1% versus the first six months of 2005. Growth in Medicare outlays picked up to 9.5% versus 6.6% and social security outlays grew 5.4%, up from 4.2% in 2004. Veterans benefits grew 17.4%. These gains offset deceleration in defense spending which grew 7.3%, less than the year earlier rate but interest expense, up 9.1, started to grow again with higher rates.
An Analysis of the President's Budgetary Proposals for Fiscal Year 2006 from the Congressional Budget Office is available here.
| US Government Finance | Mar | Feb | FY '05 - YTD | FY2004 | FY2003 | FY2002 |
|---|---|---|---|---|---|---|
| Budget Balance | $-71.2B | $-113.9B | $-294.6B | $-412.1B | $-377.6B | $-157.8B |
| Net Revenues | $148.7B | $100.9B | 10.4% | 5.5% | -3.8% | -6.9% |
| Net Outlays | $220.0B | $214.8B | 7.1% | 6.1% | 7.4% | 7.9% |
by Louise Curley April 18, 2005
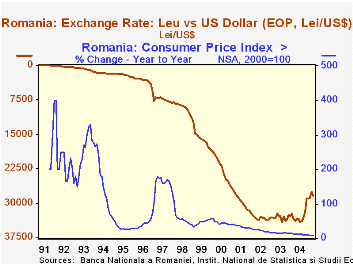
On Wednesday, April 20, the central bank of Romania will issue new banknotes and coins of the new leu, which will become the legal currency as of July 1. One new leu is equal to 1,000 old lei.
Romania is one of a number of countries that have redenominated there currencies after they have tamed the inflation that had eroded the value of their currencies. Romania experienced three bouts of hyper inflation in the nineties--the first, producing an inflation rate as measured by the year-to-year percent increase in the consumer price index of 350% reached in March 1992, the second with a monthly peak of 309.7% in December 1993 and the third, with a monthly peak of 177.4% in June , 1997. The high rates of inflation led to continuing declines in the currency. The attached chart shows inflation, measured by the year-to-year percent increase in the consumer price index and the monthly exchange rate, Leu/US$, with the latter plotted on an inverted scale. Inflation in Romania has been declining slowly since early 2000 and has now reached 8.6% in March of this year.
A decline in the leu/US$ means that the dollar has depreciated against the leu or that the leu has appreciated against the dollar. (In the Haver data bases when the exchange rate is listed in terms of the foreign currency to the dollar, the percentage changes calculated are the percentage changes in the dollar relative to the foreign currency. In order to calculate the percent change in the foreign currency relative to the dollar, one takes the reciprocal of (1+the change in the dollar) and subtracts 1. For example the change in the leu/US$ from March 2004 to March 2005 was -14.99%, meaning that the dollar depreciated 14.99% against the leu or that the leu appreciated {(1/85.01)-1} or 17.6%.
| Romania | Mar 05 | Feb 05 | Mar 04 | M/M | Y/Y | 2004 | 2003 | 2002 |
|---|---|---|---|---|---|---|---|---|
| Consumer Price Index (%Y/Y) | 8.63 | 8.92 | 13.09 | -0.19 | -4.46 | 11.86 | 15.36 | 22.51 |
| Lei/US$ (EOP) | 28429 | 27473 | 33440 | 3.48 | -14.99 | -1082 | -2.70 | 6.02 |

Tom Moeller
AuthorMore in Author Profile »Prior to joining Haver Analytics in 2000, Mr. Moeller worked as the Economist at Chancellor Capital Management from 1985 to 1999. There, he developed comprehensive economic forecasts and interpreted economic data for equity and fixed income portfolio managers. Also at Chancellor, Mr. Moeller worked as an equity analyst and was responsible for researching and rating companies in the economically sensitive automobile and housing industries for investment in Chancellor’s equity portfolio. Prior to joining Chancellor, Mr. Moeller was an Economist at Citibank from 1979 to 1984. He also analyzed pricing behavior in the metals industry for the Council on Wage and Price Stability in Washington, D.C. In 1999, Mr. Moeller received the award for most accurate forecast from the Forecasters' Club of New York. From 1990 to 1992 he was President of the New York Association for Business Economists. Mr. Moeller earned an M.B.A. in Finance from Fordham University, where he graduated in 1987. He holds a Bachelor of Arts in Economics from George Washington University.
More Economy in Brief


