 Global| Jan 04 2010
Manufacturing Is Digging Out
Summary
The PMI indices for MFG from Markit show an ongoing improvement across the e-zone. The e-Zone index is still some 8.9 points from its cycle peak but it has risen by 18 points from its cycle low. Greece at 10.6 points above its cycle [...]
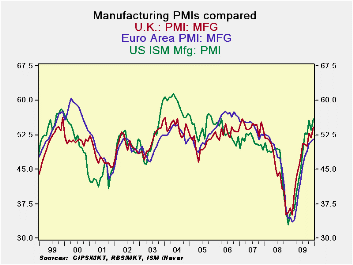
The PMI indices for MFG from Markit show an ongoing improvement across the e-zone. The e-Zone index is still some 8.9 points from its cycle peak but it has risen by 18 points from its cycle low. Greece at 10.6 points above its cycle low has had the smallest recovery from its low point. The UK Germany and France have risen the most from their respective low points but the UK stands the closest to its cycle peak reading standing only 2.2 points below its cycle peak reading in December. Spain, Greece and France are still the farthest away from their respective cycle peaks.
In December among the countries in the table only Spain saw a set back. This is marked improvement from November when five of these countries experienced a set back in the month’s MFG PMI reading.
Spain’s index has fallen on balance over the last three months. It is the only one in this group to do so. However Austria and Greece rose by less than 0.5 points on balance over the last three months compared to an e-Zone index rise of 2.3points. .The e-Zone advance is now being led by improvements in Italy and in Germany but all the e-Zone countries in the table above are advancing at a slower rate than they had over six months (multiply the respective three month gains by a factor of two to see this). The UK, an EU member, is an exception to this trend as it is still accelerating.
Spain, Greece and Ireland are the only countries in the table that are not back into pre-recession ranges for their MFG PMI readings (levels). The UK is the only country that is near the top of its pre-recession range in terms of its overall PMI index (March 2000- Jan 2008).
On balance the e-Zone is still making progress. Some choppiness in the indices in this region is to be expected if the recovery is going to continue but lose some of its gusto. If the recovery is going to gain speed we will need to see these indices continue to advance. The signals right now seem to favor a period of consolidation and of continued but slow growth progress.
| Changes in Markit MFG Indices | ||||||||
|---|---|---|---|---|---|---|---|---|
| Changes Mo/Mo | Change on Frequency | |||||||
| Dec-09 | Nov-09 | Oct-09 | 3Mo | 6Mo | 12Mo | From Peak | From Low | |
| Euro-13 | 0.39 | 0.47 | 1.44 | 2.30 | 8.97 | 17.72 | -8.9 | 18.0 |
| Germany | 0.25 | 1.40 | 1.39 | 3.04 | 11.81 | 20.03 | -8.2 | 20.7 |
| France | 0.31 | -1.21 | 2.62 | 1.72 | 8.85 | 19.80 | -10.1 | 19.9 |
| Italy | 0.71 | 0.85 | 1.66 | 3.22 | 8.11 | 15.26 | -9.2 | 16.2 |
| Spain | -0.09 | -1.02 | 0.48 | -0.63 | 2.43 | 16.70 | -12.3 | 16.7 |
| Austria | 0.88 | -1.12 | 0.74 | 0.50 | 8.80 | 15.80 | -8.0 | 17.7 |
| Greece | 1.54 | -0.72 | -0.49 | 0.33 | 1.12 | 7.83 | -10.6 | 10.6 |
| Ireland | 0.02 | 0.78 | 1.44 | 2.24 | 6.34 | 10.94 | -7.6 | 15.6 |
| EU | ||||||||
| UK | 2.33 | -1.16 | 2.94 | 4.11 | 6.87 | 18.53 | -2.2 | 19.1 |
| Percentile is over range since March 2000 | ||||||||
by Tom Moeller January 4, 2010
 Improvement
in the U.S. factory sector continued last month from its nadir reached
twelve months earlier. The National Association of Purchasing
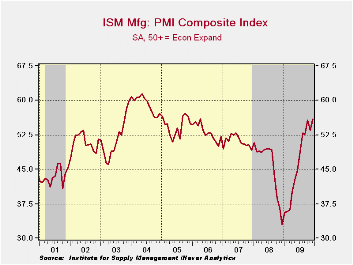
Management reported that its December composite index showed unexpected
strength with a rise to 55.9 from 53.6 during November. The latest
figure was the highest since April 2006 and it was up from the low of
32.9 reached last December. A more modest gain to 54.0 had been the
Consensus expectation. (Any reading above the break-even point of 50
suggests rising activity.) The ISM data is available in Haver's USECON
database.
Improvement
in the U.S. factory sector continued last month from its nadir reached
twelve months earlier. The National Association of Purchasing
Management reported that its December composite index showed unexpected
strength with a rise to 55.9 from 53.6 during November. The latest
figure was the highest since April 2006 and it was up from the low of
32.9 reached last December. A more modest gain to 54.0 had been the
Consensus expectation. (Any reading above the break-even point of 50
suggests rising activity.) The ISM data is available in Haver's USECON
database.
The positive factory-sector growth rate suggested by the ISM index is in line with recoveries accompanying past upturns from severe recessions. To mirror the strength of those recoveries, however, the index still needs to rise to a level near or above the level of 60.
The new orders index showed the greatest m/m gain with its increase to a high of 65.5 from 60.3 in November. Working the other way, the export order index fell moderately to 54.5 from its recent high. Nevertheless the index was up from its low of 35.5 last December. During the last ten years there has been a 53% correlation between the index and the q/q change in real exports of goods in the GDP accounts.
The employment index showed a smaller gain 52.0.
Nevertheless, the level indicated positive growth in factory-sector
payrolls. 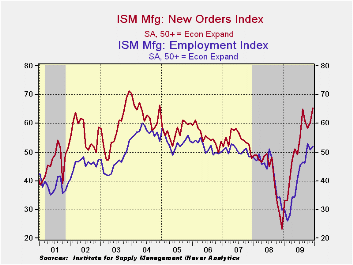 It has increased from a low reading of 26.1 last February.
Seventeen percent of respondents indicated higher payrolls versus only
seven percent last December. Eighteen percent indicated a lower level
of hiring versus fifty percent last December. During the last ten years
there has been a 90% correlation between the index level and the
three-month change in manufacturing payrolls.
It has increased from a low reading of 26.1 last February.
Seventeen percent of respondents indicated higher payrolls versus only
seven percent last December. Eighteen percent indicated a lower level
of hiring versus fifty percent last December. During the last ten years
there has been a 90% correlation between the index level and the
three-month change in manufacturing payrolls.
The production component rose modestly to 61.8 but remained lower than its October high of 63.3. During the last ten years there has been an 84% correlation between the level of the production component of the composite index and the three-month growth in factory sector industrial production. It is appropriate to correlate the ISM index level with factory sector output growth because the ISM index is a diffusion index. It measures growth by using all of the positive changes in activity added to one half of the zero change in activity measures.
 A two
point gain in the inventory
component to 43.4 recovered some of its November decline but it still
was down from the October high. Thirteen percent (NSA) of respondents
indicated that they were raising inventory levels versus 18% last
December. During the strong 2005 inventory accumulation 26% of firms
indicated that they were raising inventories. Thirty percent of
respondents indicated lower inventories.
A two
point gain in the inventory
component to 43.4 recovered some of its November decline but it still
was down from the October high. Thirteen percent (NSA) of respondents
indicated that they were raising inventory levels versus 18% last
December. During the strong 2005 inventory accumulation 26% of firms
indicated that they were raising inventories. Thirty percent of
respondents indicated lower inventories.
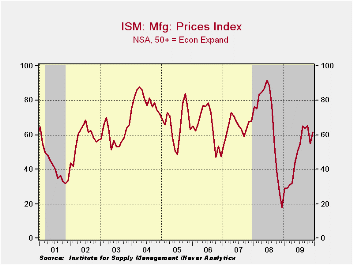
The separate index of prices paid made up more than half of its November decline and was up from the December low of 18.0. During the last twenty years there has been a 79% correlation between the price index and the three-month change in the PPI for intermediate goods.
The ISM data are available in Haver's USECON database.
Monetary Policy and the Housing Bubble is the title of yesterday's speech by Fed Chairman Ben S. Bernanke and it is available here.
| ISM Mfg | December | November | October | Dec. '08 | 2009 | 2008 | 2007 |
|---|---|---|---|---|---|---|---|
| Composite Index | 55.9 | 53.6 | 55.7 | 32.9 | 46.3 | 45.5 | 51.1 |
| New Orders | 65.5 | 60.3 | 58.5 | 23.1 | 51.7 | 42.1 | 54.3 |
| Employment | 52.0 | 50.8 | 53.1 | 29.9 | 40.6 | 43.2 | 50.5 |
| Production | 61.8 | 59.9 | 63.3 | 26.3 | 50.3 | 45.2 | 54.1 |
| Supplier Deliveries | 56.6 | 55.7 | 56.9 | 45.7 | 51.4 | 51.6 | 51.2 |
| Inventories | 43.4 | 41.3 | 46.9 | 39.6 | 37.2 | 45.5 | 45.4 |
| Prices Paid Index (NSA) | 61.5 | 55.0 | 65.0 | 18.0 | 48.3 | 66.5 | 64.6 |
by Tom Moeller January 4, 2010
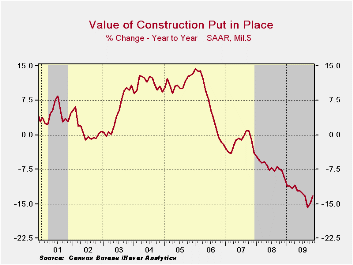 Though its
rate of decline has moderated, construction spending has continued to
move lower. During November construction outlays fell 0.6% after a
little-revised 0.5% October shortfall. The latest decline left the y/y
change at -13.2% which was improved just modestly from the weakest
-15.8% September comparison. The latest decline about matched Consensus
estimates.
Though its
rate of decline has moderated, construction spending has continued to
move lower. During November construction outlays fell 0.6% after a
little-revised 0.5% October shortfall. The latest decline left the y/y
change at -13.2% which was improved just modestly from the weakest
-15.8% September comparison. The latest decline about matched Consensus
estimates.
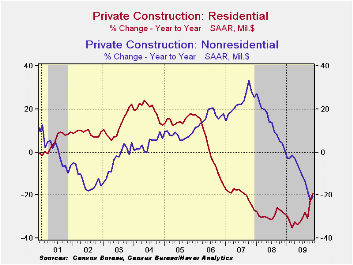
Residential building activity renewed its decline with a 1.6% fall following a 4.8% October gain. The decline owed to a 4.1% (-44.4% y/y) drop in multi-family building and a 3.9% (-2.8% y/y) shortfall in spending on improvements. Single-family construction rose 1.3% (-25.2% y/y) for the sixth consecutive monthly increase.
Nonresidential building activity was roughly unchanged after a steep 4.8% October decline. Since the 2008 peak, activity has fallen by 22.5%. Spending in the food & beverage industry declined 44.1% y/y while expenditures in the lodging were off by nearly one-half. Commercial building overall fell 40.5% y/y while office building dropped by more than one-third. Relatively moderate were the declines in the education (-18.8% y/y), religious (-18.3% y/y) and health care (-16.1% y/y) sectors. Factory sector spending (-7.0% y/y) was buoyed by gains in the chemical and in the computer/electronic/electrical sectors.
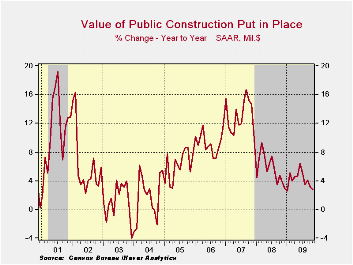
In the public sector, construction overall fell a modest 0.4% during November but y/y expenditures rose despite lower tax revenues. Building activity on highways & streets fell 2.9% m/m but rose 5.7% y/y due to the focus on infrastructure rebuilding. Public spending on health care facilities increased a strong 12.2% y/y but building in the education sector was off 2.6% y/y.
The construction put-in-place figures are available in Haver's USECON database.
| Construction (%) | November | October | September | Y/Y | 2008 | 2007 | 2006 |
|---|---|---|---|---|---|---|---|
| Total | -0.6 | -0.5 | -1.6 | -13.2 | -6.9 | -1.6 | 6.3 |
| Private | -0.7 | -0.8 | -2.4 | -20.0 | -11.1 | -5.7 | 5.5 |
| Residential | -1.6 | 4.8 | -0.6 | -19.2 | -29.1 | -19.7 | 1.0 |
| Nonresidential | -0.0 | -4.8 | -3.7 | -20.6 | 13.2 | 23.1 | 16.2 |
| Public | -0.4 | 0.0 | -0.1 | 2.7 | 5.6 | 13.1 | 9.3 |
by Louise Curley January 4, 2010
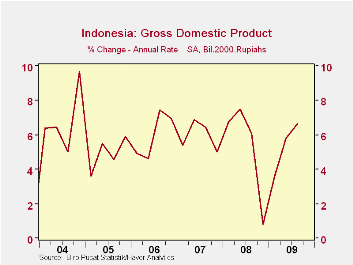 While
Indonesia has had extensive damage from earthquakes, it has so far
escaped a recession. The closest it has come was the fourth
quarter of 2008 when real gross domestic product increased at an annual
rate of only 0.80%. Subsequent increases have been 3.58% in
the first quarter of 2009, 5.49% in the second and 6.64 in the third
quarter. The annual rates of increase in real GDP over the past six
years are shown in the first chart.
While
Indonesia has had extensive damage from earthquakes, it has so far
escaped a recession. The closest it has come was the fourth
quarter of 2008 when real gross domestic product increased at an annual
rate of only 0.80%. Subsequent increases have been 3.58% in
the first quarter of 2009, 5.49% in the second and 6.64 in the third
quarter. The annual rates of increase in real GDP over the past six
years are shown in the first chart.
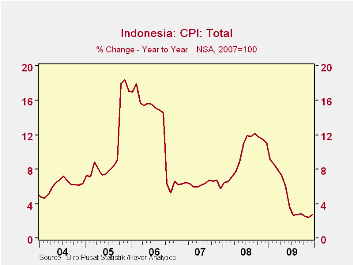
Today, the consumer price index for December was released. Inflation continues to be well behaved although there has been a slight increase in the last two months. The rate of inflation as measured by the year to year increase in the seasonally unadjusted consumer price index was 2.78% down from 11.06% in December of 2008. The course of inflation in Indonesia is shown in the second chart.
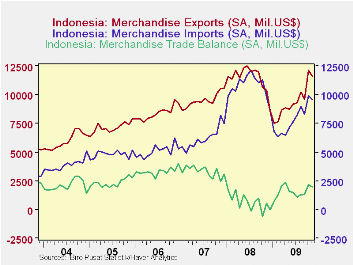
Also released today were Indonesia's exports, imports and balance of trade. There has been a rising trend in the balance of trade from the 640 million USD deficit in October,2008. Exports at 11,562 million USD are below the peak level of 12,499 million USD reached in June of 2008 and imports at 9,563 million USD are well below the peak of 12,142 million USD reached in July 2008. The third chart shows exports, imports and the balance of trade over the past six years.
| INDONESIA | Q4 09 |
Q3 09 |
Q2 09 |
Q1 09 |
Q4 08 |
Q3 08 |
Q2 08 |
Q1 08 |
|
|---|---|---|---|---|---|---|---|---|---|
| Real Gross Domestic Product | |||||||||
| Q/Q Annual Rate of Change in Real GDP (%) | -- | 6.64 | 5.49 | 3.58 | 0.80 | 6.08 | 7.50 | 6.75 | |
| Dec 09 |
Nov 09 |
Oct 09 |
Sep 09 |
Aug 09 |
Jul 09 |
Jun 09 |
May 09 |
Apr 09 |
|
| CPI Y/Y % Change (%) | 2.78 | 2.41 | 2.57 | 2.83 | 2.75 | 2.71 | 3.65 | 6.04 | 7.31 |
| Trade | Dec 09 |
Nov 09 |
Oct 09 |
Sep 09 |
Aug 09 |
Jul 09 |
Jun 09 |
May 09 |
Apr 09 |
| Exports (Millions US $) | -- | 11562 | 12108 | 9588 | 10257 | 9260 | 9135 | 8756 | 8872 |
| Imports (Millions US $) | -- | 9563 | 9903 | 8288 | 8963 | 8161 | 7645 | 7165 | 6512 |
| Balance (Millions US $) | -- | 1999 | 2205 | 1308 | 1294 | 1099 | 1490 | 1591 | 2362 |

Robert Brusca
AuthorMore in Author Profile »Robert A. Brusca is Chief Economist of Fact and Opinion Economics, a consulting firm he founded in Manhattan. He has been an economist on Wall Street for over 25 years. He has visited central banking and large institutional clients in over 30 countries in his career as an economist. Mr. Brusca was a Divisional Research Chief at the Federal Reserve Bank of NY (Chief of the International Financial markets Division), a Fed Watcher at Irving Trust and Chief Economist at Nikko Securities International. He is widely quoted and appears in various media. Mr. Brusca holds an MA and Ph.D. in economics from Michigan State University and a BA in Economics from the University of Michigan. His research pursues his strong interests in non aligned policy economics as well as international economics. FAO Economics’ research targets investors to assist them in making better investment decisions in stocks, bonds and in a variety of international assets. The company does not manage money and has no conflicts in giving economic advice.
More Economy in Brief


