 Global| Jul 22 2004
Leading Indicators Fell
by:Tom Moeller
|in:Economy in Brief
Summary
The July Composite Index of Leading Economic Indicators reported by the Conference Board fell 0.3%. Only a 0.1% reduction had been expected. June's 0.2% fall was revised to 0.1%. Among the 10 components, six contributed negatively in [...]
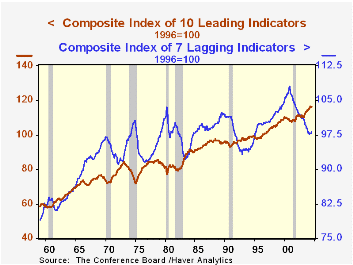
The July Composite Index of Leading Economic Indicators reported by the Conference Board fell 0.3%. Only a 0.1% reduction had been expected. June's 0.2% fall was revised to 0.1%.
Among the 10 components, six contributed negatively in July and four positively. Financial indicators, stock prices and the yield curve, pulled the index down a total of 0.29%. Building permits gave the largest boost, 0.26%.
The leading index is based on eight previously reported economic data series and two, orders for consumer and for capital goods, which are estimated.
The coincident indicators ticked 0.1% higher, while the original 0.1% rise in June was revised to zero change. In this July report, employment and production both contributed to the modest rise. The lagging index gained 0.5%, also moved by financial components: the prime rate rose 25 basis points and bank loans to business rose by their largest amount since early 2000.
Lagging indicators appear to be most useful in confirming the development of business cycle expansions. As seen in the accompanying graph, the index tends to continue falling even after the economy has begun to recover, so it is the upturn in the "laggers" that indicates the maturing of the expansion process.
Visit the Conference Board's site for coverage of leading indicator series from around the world.
| Business Cycle Indicators | July | June | May | Y/Y | 2003 | 2002 | 2001 |
|---|---|---|---|---|---|---|---|
| Leading | -0.3% | -0.1% | 0.4% | 2.8% | 1.3% | 2.2% | -0.8% |
| Coincident | 0.1% | 0.0% | 0.3% | 2.4% | 0.4% | -0.5% | -0.5% |
| Lagging | 0.5% | 0.0% | 0.1% | -1.3% | -2.2% | -2.8% | -1.4% |
by Carol Stone August 19, 2004
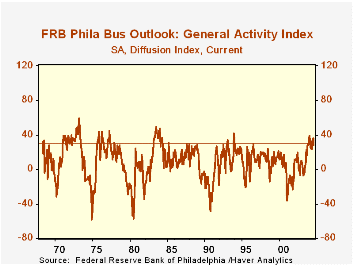
The Philadelphia Fed’s index of general business conditions in the manufacturing sector moderated in the August survey, falling to 28.5 from 36.1 in July. The 8.2-point decrease was weaker than Consensus expectations for a marginal decline to 34.5.
Every one of the sub-indexes had a lower reading in August than in July, particularly new and unfilled orders; delivery times had a net negative index of -6.8.
The business conditions index reflects a separate survey question, not a weighted combination of the sub-indexes. Moreover, the August value at 28.5 is "weak" only relative to some prior months this year. The performance so far this year, which averages 30.5 in the first eight months, is among the highest recorded in the survey's 36-year history. In the accompanying graph, a horizontal line at that average shows how few occasions the survey has been able to sustain higher readings for more than a few months.
Further, the separate index of business conditions expected in six months turned upward sharply from 36.3 in July to 52.7 for this month.
The prices paid index rebounded after July's moderation. No details are collected on the source of price changes, but we'd guess that energy costs are a major culprit. 54.7% of respondents reported increases in prices paid and only 1% experienced decreases. More companies than that had seen prices rise in earlier months this year, but this is the smallest number garnering price decreases in nearly four years.
The Philadelphia Fed index is based on a survey of 250 regional manufacturing firms, but these firms sell nationally and internationally. The data are carried in Haver's "SURVEYS" database, along with an extensive collection of similar surveys by other Federal Reserve Banks.
The latest Business Outlook survey from the Philadelphia Federal Reserve Bank can be found here.
| Philadelphia Fed Business Outlook | Aug | July | June | Aug '03 | 2003 | 2002 | 2001 |
|---|---|---|---|---|---|---|---|
| General Activity Index | 28.5 | 36.1 | 28.9 | 21.9 | 10.6 | 7.7 | -17.2 |
| Prices Paid Index | 53.7 | 46.3 | 51.9 | 14.4 | 16.7 | 12.2 | -0.9 |
by Carol Stone August 19, 2004
Initial unemployment insurance claims fell 3,000 to 331,000 last week and the prior week was up revised marginally. Claims were once again lower than expected; the consensus forecast was 335,000 claims.
The 4-week moving average of initial claims fell to 337,000 (-15.1% y/y).
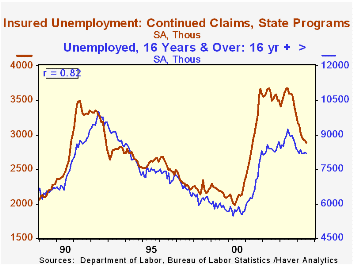
Continuing claims for unemployment insurance rose 16,000 following a revised 13,000 drop the week prior. These continuing claims, that is, the total number of unemployment benefit recipients, run closely parallel to the total number unemployed in the monthly employment survey; the correlation has been 82% over the last 15 years.
The insured rate of unemployment remained at 2.3%, where it has hovered since the end of April.
| Unemployment Insurance (000s) | 08/14/04 | 08/07/04 | 07/31/04 | Y/Y | 2003 | 2002 | 2001 |
|---|---|---|---|---|---|---|---|
| Initial Claims | 331 | 334 | 337 | -14.7% | 399 | 403 | 403 |
| Continuing Claims | -- | 2904 | 2888 | -19.3% | 3,516 | 3,564 | 2974 |

Tom Moeller
AuthorMore in Author Profile »Prior to joining Haver Analytics in 2000, Mr. Moeller worked as the Economist at Chancellor Capital Management from 1985 to 1999. There, he developed comprehensive economic forecasts and interpreted economic data for equity and fixed income portfolio managers. Also at Chancellor, Mr. Moeller worked as an equity analyst and was responsible for researching and rating companies in the economically sensitive automobile and housing industries for investment in Chancellor’s equity portfolio. Prior to joining Chancellor, Mr. Moeller was an Economist at Citibank from 1979 to 1984. He also analyzed pricing behavior in the metals industry for the Council on Wage and Price Stability in Washington, D.C. In 1999, Mr. Moeller received the award for most accurate forecast from the Forecasters' Club of New York. From 1990 to 1992 he was President of the New York Association for Business Economists. Mr. Moeller earned an M.B.A. in Finance from Fordham University, where he graduated in 1987. He holds a Bachelor of Arts in Economics from George Washington University.
More Economy in Brief


