 Global| Oct 03 2008
Largest Decline in U.S. Payrolls Since Early 2003
by:Tom Moeller
|in:Economy in Brief
Summary
Nonfarm payrolls declined 159,000 during September, according to the Bureau of Labor Statistics. The latest decline was the largest during each of the last nine months and it exceeded Consensus expectations for a 105,000. It was [...]
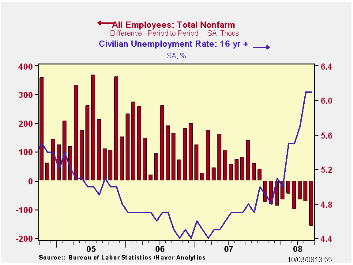
Nonfarm payrolls declined 159,000 during September, according to the Bureau of Labor Statistics. The latest decline was the largest during each of the last nine months and it exceeded Consensus expectations for a 105,000. It was accompanied by modest revisions to prior months' figures. Payrolls have fallen by 760,000, or by 0.6%, this year.The latest figures were depressed by Hurricanes Gustav & Ike.
During the last three months payrolls fell at a 0.9% annual rate. That is the quickest rate of decline during this cycle but it compares to a rate in excess of -2.0% by the end of the 2001 recession.
The length of the average workweek slipped to 33.6 hours. Combined with recent declines in employment, an unchanged workweek for 3Q versus 2Q left aggregate hours-worked down at a 2.0% rate last quarter. That suggests no growth in real 3Q GDP assuming a 2.0% rate of advance in worker productivity.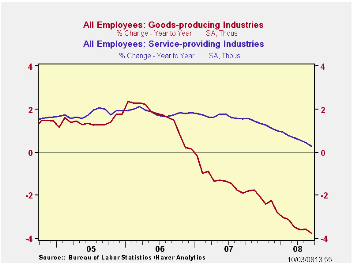
The unemployment rate held steady at 6.1% last month and that equaled expectations. Nevertheless, it was the highest level since September of 2003.
Household sector employment fell 222,000 (-0.7% y/y) after an unrevised 342,000 worker August decline. It was the seventh monthly decline this year. The level of the unemployed rose 101,000 (30.8% y/y) following a 592,000 August increase. The labor force fell 121,000 (+0.8% y/y) during September. The labor force participation rate slipped to 66.0% after three months at 6.1%. It was 66.0% during all of last year and 66.2% in 2006. The participation rate amongst adult men was unchanged at 75.8%, about the same as averaged last year, but amongst adult women, it fell to 60.8% which near the lowest level this year.
The average duration of unemployment increased by one full week to 18.4. The median duration of unemployment, however, rose to a lesser 10.2 weeks, up from 8.5 weeks during all of last year. The number of those unemployed for more than 27 weeks increased 9.1% (56.9% y/y), about as it did during August.
From the establishment survey, the number of private sector jobs fell 168,000 (-0.7% y/y). Private service sector industries fell 91,000 (0.0% y/y), the largest decline since early 2003. Nevertheless, September logged the eighth decline, and the largest, in the last nine months. Employment in trade, transportation & utilities fell by 58,000 (-1.3% y/y). Retail sector jobs plunged 41,100 (-1.6% y/y) with motor vehicle & parts dealers accounting for roughly a quarter of the decline. Jobs in the information sector fell 3,000 last month (-1.7% y/y) while financial sector jobs fell 17,000 (-1.3% y/y). The professional & business service industry shed 27,000 (0.9% y/y) jobs. Temporary help services jobs which often are a leading indicator of employment growth, fell 24,100 (-9.1% y/y). These declines were somewhat offset by continued positive employment growth in the education & health industries, up 25,000 (3.1% y/y) during September.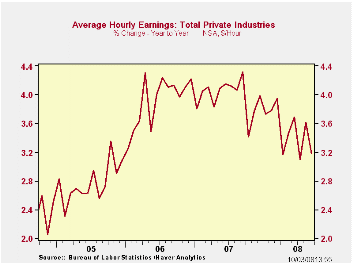
Factory sector jobs fell 51,000 after a 56,000 worker decline during August (-3.2% y/y). Motor vehicle & parts jobs fell 18,200 (-14.1% y/y) but computer & electronic product jobs were unchanged (-0.9% y/y). In the nondurables sector employment fell 14,000 (-2.3% y/y).
Construction sector employment fell another 35,000 during September which was the largest decline in three months.
Government sector jobs moved higher by 9,000 (1.4% y/y) led by a 5,000 (1.4% y/y) worker increase in state government hiring. Federal government hiring rose by 3,000 (1.1% y/y) while local governments added 1,000 (1.5% y/y) workers.
The one month diffusion index, which measures the breadth of job gain or loss (50 is the break-even level), fell to its lowest level of this cycle (38.1%). The three-month index also was at its cycle low (36.1%) and the three-month figure for the factory sector was even weaker at 20.8%.
Average hourly earnings rose just 0.2%. Factory sector earnings reversed their August decline and rose 0.2% (2.6% y/y) while private service sector earnings also rose 0.2% (3.4% y/y).
| Employment: 000s | September | August | July | Y/Y | 2007 | 2006 | 2005 |
|---|---|---|---|---|---|---|---|
| Payroll Employment | -159 | -73 | -67 | -0.4% | 1.1% | 1.8% | 1.7% |
| Previous | -- | -84 | -60 | -- | 1.3% | 1.9% | 1.7% |
| Manufacturing | -51 | -56 | -40 | -3.2% | -1.9% | -0.5% | -0.6% |
| Construction | -35 | -31 | -23 | -6.1% | -1.0% | 4.9% | 5.2% |
| Average Weekly Hours | 33.6 | 33.7 | 33.7 | 33.8 (Sept. '07) | 33.8 | 33.9 | 33.8 |
| Average Hourly Earnings | 0.2% | 0.4% | 0.3% | 3.4% | 4.0% | 3.9% | 2.7% |
| Unemployment Rate | 6.1% | 6.1% | 5.7% | 4.7% (Sept. '07) | 4.6% | 4.6% | 5.1% |

Tom Moeller
AuthorMore in Author Profile »Prior to joining Haver Analytics in 2000, Mr. Moeller worked as the Economist at Chancellor Capital Management from 1985 to 1999. There, he developed comprehensive economic forecasts and interpreted economic data for equity and fixed income portfolio managers. Also at Chancellor, Mr. Moeller worked as an equity analyst and was responsible for researching and rating companies in the economically sensitive automobile and housing industries for investment in Chancellor’s equity portfolio. Prior to joining Chancellor, Mr. Moeller was an Economist at Citibank from 1979 to 1984. He also analyzed pricing behavior in the metals industry for the Council on Wage and Price Stability in Washington, D.C. In 1999, Mr. Moeller received the award for most accurate forecast from the Forecasters' Club of New York. From 1990 to 1992 he was President of the New York Association for Business Economists. Mr. Moeller earned an M.B.A. in Finance from Fordham University, where he graduated in 1987. He holds a Bachelor of Arts in Economics from George Washington University.
More Economy in Brief


