 Global| Aug 01 2005
July ISM Factory Index Highest This Year
by:Tom Moeller
|in:Economy in Brief
Summary
The Institute of Supply Management reported that last month the Composite Index of activity in the manufacturing sector jumped nearly three points from June to 56.6. The latest is the highest level for the index since December and [...]
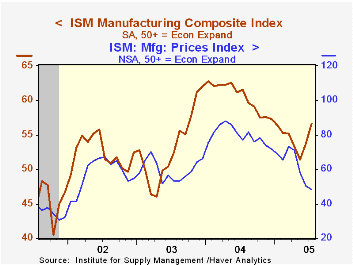
The Institute of Supply Management reported that last month the Composite Index of activity in the manufacturing sector jumped nearly three points from June to 56.6. The latest is the highest level for the index since December and easily beat Consensus expectations for a modest up tick to 54.5.
During the last twenty years there has been a 64% correlation between the level of the Composite Index and the three month growth in factory sector industrial production.
Pricing in the factory sector weakened further with the prices paid index falling below 50, to 48.5, for the first time since February 2002.
Production strengthened materially as indicated by a 5.6 jump in the index to 61.2, its highest level since last September. Inventory restocking apparently provided little of the boost to output as the inventory index fell to the lowest level since April 2004.
New orders added to the strong gain in June and rose to the year's highest level of 60.6 with higher export orders leading the gain. The export order index recovered all of the prior month's drop with a 5.5 point jump to 55.9.
Job growth improved as well. After two months below the break even level of 50 the employment index rose 3.3 points to 53.2, its highest since March. During the last twenty years there has been a 67% correlation between the level of the ISM Employment Index and the three month growth in factory sector employment.
| ISM Manufacturing Survey | July | June | July '04 | 2004 | 2003 | 2002 |
|---|---|---|---|---|---|---|
| Composite Index | 56.6 | 53.8 | 61.6 | 60.5 | 53.3 | 52.4 |
| New Orders Index | 60.6 | 57.2 | 63.8 | 63.5 | 57.9 | 56.5 |
| Prices Paid Index (NSA) | 48.5 | 50.5 | 77.0 | 79.8 | 59.6 | 57.6 |
by Tom Moeller August 1, 2005
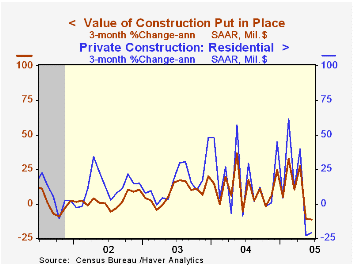
The June value of construction put in place fell 0.3% following a deepened decline in May. June was the fifth monthly drop this year. Consensus expectations had been for a 0.7% increase.
The 2005 declines in construction spending generally have been moderate especially when set against a 7.5% upward spike in February.
Private residential building activity added to earlier month's declines with a 0.4% dip but remained up 9.1% versus last year. A 12.2% pop in February was driven by improvements. The value of new single family building rose 0.2% (7.6% y/y) for the seventh consecutive monthly gain.
Nonresidential building rose 0.2% following the downwardly revised 2.1% May decline. Multi-retail building was quite strong, up 2.3% (22.1% y/y), led by shopping mall construction which rose 15.8% (-7.2% y/y).
Public construction spending dipped 0.5% after an upwardly revised 3.2% May gain. Construction activity on highways & streets, nearly one third of the value of public construction spending, dipped 0.4% (+8.6% y/y).
These more detailed categories represent the Census Bureau’s reclassification of construction activity into end-use groups. Finer detail is available for many of the categories; for instance, commercial construction is shown for Automotive sales and parking facilities, drugstores, building supply stores, and both commercial warehouses and mini-storage facilities. Note that start dates vary for some seasonally adjusted line items in 2000 and 2002 and that constant-dollar data are no longer computed.
| Construction Put-in-place | June | May | Y/Y | 2004 | 2003 | 2002 |
|---|---|---|---|---|---|---|
| Total | -0.3% | -1.7% | 7.9% | 11.1% | 5.4% | 1.0% |
| Private | -0.2% | -3.1% | 8.1% | 13.8% | 6.3% | -0.4% |
| Residential | -0.4% | -3.4% | 9.1% | 18.5% | 12.9% | 8.5% |
| Nonresidential | 0.2% | -2.1% | 5.6% | 3.9% | -5.4% | -13.0% |
| Public | -0.5% | 3.2% | 7.2% | 2.5% | 2.7% | 5.7% |
by Louise Curley August 1, 2005
While the number of employed persons in Japan declined 0.26% in June from May to 64.18 million on a seasonally unadjusted basis, it was 0.69% above the June, 2004 figure. The number of unemployed persons declined by 8.8% in May to June and was 9.4% below June, 2004. As a result, the unemployment rate is now 4.2% compared with 4.6% in May, 2005 and also in June, 2004.
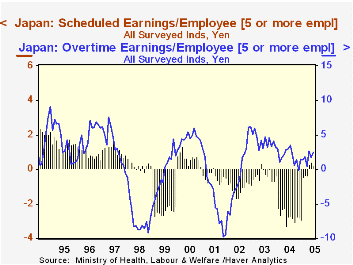
June also saw a year-to-year rise in Japanese wages. The average monthly cash wage in Japan amounted to 467,814 Yen or $4,156 at the current rate of exchange. The granting of bonuses in June and December distorts the month to month changes in the wage data that are available only on a not seasonally adjusted basis. The year to year changes are the more meaningful comparisons. In June, cash wages were almost 0.7% above the comparable figure of last year.
Cash Earnings are equal to money earned before deductions for income tax, social insurance contribution, union dues and payment for good purchased, etc. In the Haver Data Base for Japan there is a breakdown of cash earnings. Total cash earnings consist of Contractual Cash Earnings and Bonuses. Contractual Cash Earnings, in turn are the sum of Scheduled Cash Earnings and Overtime Earnings, which include, in addition to over-time payments, other special payments, such as marriage allowances, etc.
In the attached chart we show the year-to-year changes in the Scheduled Cash Earnings and Overtime Earnings. Scheduled cash earnings have shown year-to-year increases in April, May and June of this year, the first increases since April, 2003. Overtime earnings, on the other hand have shown year-to-year increases since mid 2002 and in June were 2.4% above the comparable figure for last year.
Rising employment and wages should augur well for Japanese consumer incomes and spending.
| Japan | Jun 05 | May 05 | Jun 04 | M/M% | Y/Y% | 2004 | 2003 | 2002 |
|---|---|---|---|---|---|---|---|---|
| Employment and Unemployment (No. of persons in Mil) |
||||||||
| Employed Persons | 64.18 | 64.35 | 63.74 | -0.26 | 0.69 | 63.29 | 63.16 | 63.30 |
| Unemployed Persons | 2..80 | 3.07 | 3.09 | -8.79 | -9.39 | 3.13 | 3.50 | 3.59 |
| Unemployment Rate % | 4.2 | 4.6 | 4.6 | -0.4* | -0.4* | 4.7 | 5.3 | 5.4 |
| Monthly Averages in Yen | ||||||||
| Cash Wages | 467,801 | 276,908 | 466,932 | n.m. | 1.27 | 332,598 | 341,790 | 343,219 |
| Contract Wages | 273,712 | 271,336 | 272,652 | 0.97 | 0.39 | 272,049 | 278,748 | 278,873 |
| Scheduled Wages | 254,875 | 252,332 | 254,258 | 1.01 | 0.24 | 253,106 | 260,153 | 261,000 |
| Over-Time | 18,837 | 18,742 | 18,394 | 0.51 | 2.41 | 18,943 | 18,595 | 17,873 |
| Bonus & Other Wages | 194,102 | 5,833 | 189,280 | n.m. | 2.35 | 60,549 | 63,042 | 64,344 |

Tom Moeller
AuthorMore in Author Profile »Prior to joining Haver Analytics in 2000, Mr. Moeller worked as the Economist at Chancellor Capital Management from 1985 to 1999. There, he developed comprehensive economic forecasts and interpreted economic data for equity and fixed income portfolio managers. Also at Chancellor, Mr. Moeller worked as an equity analyst and was responsible for researching and rating companies in the economically sensitive automobile and housing industries for investment in Chancellor’s equity portfolio. Prior to joining Chancellor, Mr. Moeller was an Economist at Citibank from 1979 to 1984. He also analyzed pricing behavior in the metals industry for the Council on Wage and Price Stability in Washington, D.C. In 1999, Mr. Moeller received the award for most accurate forecast from the Forecasters' Club of New York. From 1990 to 1992 he was President of the New York Association for Business Economists. Mr. Moeller earned an M.B.A. in Finance from Fordham University, where he graduated in 1987. He holds a Bachelor of Arts in Economics from George Washington University.
More Economy in Brief


