 Global| May 12 2010
JOLTS: U.S. Job Openings Steady But Hires & Fires Diverge
by:Tom Moeller
|in:Economy in Brief
Summary
The Bureau of Labor Statistics reported that labor market conditions remained in a state of flux during March. The latest Job Openings & Labor Turnover Survey (JOLTS) indicated that the job openings rate held steady at 2.0% with a [...]
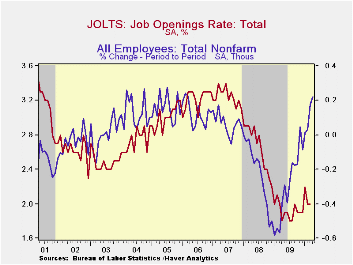
The Bureau of Labor Statistics reported that labor market conditions remained in a state of flux during March. The latest Job Openings & Labor Turnover Survey (JOLTS) indicated that the job openings rate held steady at 2.0% with a downwardly revised February reading. The job openings rate is the number of job openings on the last business day of the month as a percent of total employment plus job openings. Job availability fell 1.8% after the downwardly revised February decline. Nevertheless, the latest availability level was improved by 0.9% year-to-year. Last year job availability fell 17.8% following a 29.7% decline during 2008. The series dates back to December 2000.
Improvement in the government sector's job openings rate compensated for a modest deterioration in the private-sector during the last two months and returned it to the highest level since early last year. The private-sector job openings rate was steady following modest improvement in January. That reflected fewer professional, education & health services jobs but the number of factory and retail trade jobs grew strongly.
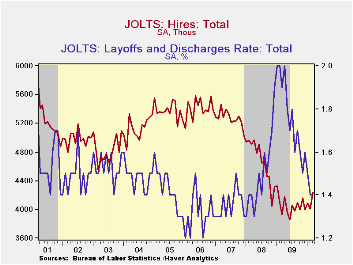
The hires rate moved up modestly to its highest since late-2008. The hires rate is the number of hires during the month divided by employment.The level of hiring rose 10% from its low in June of last year. The gain was led by a 48.5% rise in hiring in the construction sector and a 28.6% rise in factory jobs.
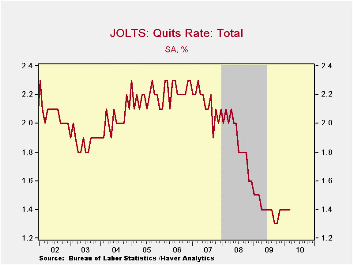
The job separations rate remained at the series' low of 3.1% with the actual number of separations off 14.7% year-to-year. Separations include quits, layoffs, discharges, and other separations as well as retirements. The layoff & discharge rate alone remained at the nineteen-month low of 1.4% as the actual number of layoffs fell 25.7% y/y after the 12.6% increase during 2009.
The JOLTS survey dates only to December 2000 but has followed the movement in nonfarm payrolls, though the actual correlation between the two series is low. A description of the Jolts survey and the latest release from the U.S. Department of Labor is available here and the figures are available in Haver's USECON database.
| JOLTS (Job Openings & Labor Turnover Survey) | March | February | January | March '09 | 2009 | 2008 | 2007 |
|---|---|---|---|---|---|---|---|
| Job Openings, Total | |||||||
| Rate (%) | 2.0 | 2.0 | 2.2 | 2.0 | 1.9 | 2.2 | 3.1 |
| Total (000s) | 2,694 | 2,647 | 2,854 | 2,671 | 2,531 | 3,078 | 4,378 |
| Hires, Total | |||||||
| Rate (%) | 3.3 | 3.1 | 3.2 | 3.0 | 37.3 | 41.1 | 45.9 |
| Total (000s) | 4,242 | 4,011 | 4,087 | 4,095 | 48,649 | 56,082 | 63,234 |
| Layoffs & Discharges, Total | |||||||
| Rate (%) | 1.4 | 1.4 | 1.5 | 1.9 | 20.7 | 17.7 | 16.5 |
| Total (000s) | 1,830 | 1,823 | 1,953 | 2,462 | 27,683 | 24,589 | 22,606 |
by Tom Moeller May 12, 2010
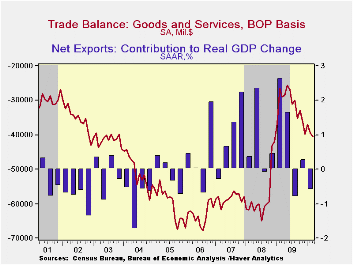
After stabilizing a bit for a few months, the U.S. foreign trade deficit broke from its range and deepened in March. The deficit of $40.4B compared to a little-revised $39.4B during February. The latest figure roughly matched Consensus expectations for a deficit of $40.0B. Nevertheless, the latest deficit was the deepest since December of 2008.
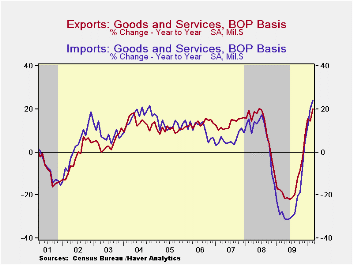
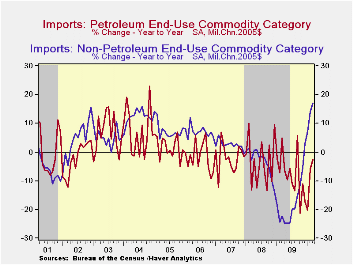
Both imports and exports were strong during March. The 3.1% increase in total imports reflected a 10.0% increase (72.4% y/y) in imports of petroleum products as crude oil prices rose m/m to $74.32 per barrel. The economic recovery in the U.S. also caused the quantity of petroleum imports to jump 7.4% m/m, even though the level remains down 2.5% y/y following declines during the prior several years.
Non-oil imports again reflected the economic recovery with a 2.6% gain which was the seventh solid increase in the last nine months. These gains followed a 17.7% decline for all of last year. The increase has been led by imports of automotive vehicles & parts which surged by nearly two-thirds y/y. Real nonauto consumer goods imports rose another 1.1% m/m (9.1% y/y) and capital goods imports jumped 1.2% m/m (16.7% y/y). Finally, services imports slipped 1.3% (+9.1% y/y). U.S. travels abroad increased 1.1% (4.5% y/y) while passenger fares surged 4.8% (5.6% y/y). "Other" transportation services imports jumped for the seventh consecutive month, posting a 3.8% increase (18.1% y/y).
Nominal exports jumped 3.2% (20.4% y/y) due to a 3.4% surge (16.9% y/y) in real merchandise exports. That was the strongest y/y gain since 1997. Real exports of non-auto consumer goods led the strength with a 5.7% jump (11.0% y/y). Real capital goods exports followed with a 1.2% gain (10.8% y/y) and auto exports nudged up by 0.4% (53.5% y/y). Exports of services rose 0.9% (11.9% y/y) with a 12.8% y/y gain in travel.
By country, the trade deficit with mainland China held roughly stable at $16.9B, roughly half its peak of $27.9B in October of 2008. Trade with China surged as exports jumped by roughly 33% y/y and imports rose by a lesser 14.7%. With Japan, the trade deficit deepened to $5.2B as imports surged by roughly 50%, due to the U.S. economic recovery, and exports rose 14.6% y/y. With the European Union, the trade deficit increased to $7.1B as exports rose 6.0% y/y but imports from Europe surged 15.8%.
| Foreign Trade | March | February | January | Y/Y | 2009 | 2008 | 2007 |
|---|---|---|---|---|---|---|---|
| U.S. Trade Deficit | $40.4B | $39.4B | $37.0B | $28.8B (3/09) | $378.6B | $695.9B | $701.4B |
| Exports - Goods & Services (m/m) | 3.2% | 0.3% | -0.2% | 20.4% | -14.9% | 11.2% | 13.2% |
| Imports - Goods & Services | 3.1 | 1.6 | -1.8 | 24.2 | -23.4 | 7.6 | 6.0 |
| Petroleum | 10.0 | 1.9 | -3.6 | 72.4 | -44.1 | 37.0 | 9.4 |
| Nonpetroleum Goods | 2.6 | 1.1 | -1.8 | 20.4 | -21.0 | 1.5 | 4.8 |
by Robert Brusca May 12, 2010
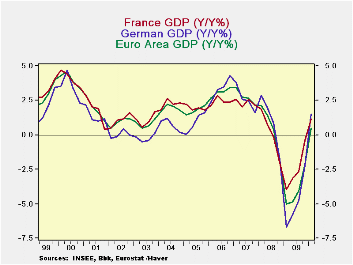
It was hardly a spectacular number for Q1 GDP from EMU although the 0.2% Q/Q gain did beat the expected gain of just 0.1% Q/Q. GDP is rising Yr/Yr for the first time Since Q3 2008 and that is something. France, Italy, the Netherlands and Germany have positive Yr/Yr gains for GDP among the early GDP reporters. The UK and Greece are still showing Yr/Yr GDP declines. Germany and France show the strongest EU/EMU Yr/Yr gains among those that have reported at 1.5% and 1.2%, respectively. Both are short of the US mark of 2.5%. The US recovery seems to have gathered pace while in Europe growth rates are still struggling to cobble together positive numbers.
Obviously in the current situation we are eager to see results from Spain, Portugal and Ireland, but they have not yet reported. This morning Spain did announce some further budget cuts and Portugal said in was in the midst of planning more cuts. Greece’s GDP is still falling but at least the pace of decline did not worsen this quarter.
Gold is making new highs on the expectation that the European debt bomb will explode. But what we see instead is evidence that, at least to start things out, the key problem-countries are taking some of the needed steps toward austerity and success. Spain and Portugal seem to be using the new EMU financial back-stop to good purpose by using its protective influence as a chance to make some much-needed changes. I think that this sort of effort flies in the face of the gold market speculation. Greece remains a problem issue, since its people are not really on board for what its politicians signed them up for. But that could change when the Greek people realize that there is no ‘plan B’ for them. They are at the end of their rope with this bailout offer. And, if they are the only problem country in EMU and the rest get their act in order, I don’t see how an intransigent Greece, by itself, drives gold prices higher – certainly not form here.
Today the Euro-Area also released March industrial output figures. MFG IP grew at a 14.8% pace in Q1 in the Zone. In the quarter output gains were led by France Italy and Germany, in that order, followed by the UK at 4.9% and then Spain at -4.3%. Among these five large EU countries only Spain showed a quarterly drop in IP, but all had Yr/Yr increases from March of one year ago; the UK’s 3.3% Yr-o-Yr gain from March of 2009 is the smallest gain of the lot on that basis.
That's quit a bit better than the GDP report seems. Of course, part of the problem is that Europe’s growth is substantially export-led and that MFG is pulling the whole economy ahead. The consumer sector remains weak and the services sector ahs not gotten into gear. Consumers remain the largest piece of the economy so the bulging IP numbers make for great headlines but the ‘bulge’ is all ‘steroids’ since it takes consumer participation and job growth to make great economic growth (GDP). Europe is not there yet. We conclude these points about sector participations from the other monthly data we have in hand since Euro-GDP reports come in a ‘flash’ format without any detail. The detail will be filled in later. We are all interested in that detail, about sectors and about member by member economic performance. We have yet to see it.
| Euro-Area And Main G-10 Country GDP Results | |||||||
|---|---|---|---|---|---|---|---|
| Quarter over quarter-Saar | Year/Year | ||||||
| GDP | Q1-10 | Q4-09 | Q3-09 | Q1-10 | Q4-09 | Q3-09 | Q2-09 |
| EMU-15 | 0.8% | 0.2% | 1.6% | 0.5% | -2.2% | -4.1% | -4.9% |
| France | 0.5% | 2.2% | 1.0% | 1.2% | -0.4% | -2.6% | -3.2% |
| Germany | 0.6% | 0.7% | 2.9% | 1.5% | -2.2% | -4.8% | -5.8% |
| Greece | -3.1% | -3.1% | -1.9% | -2.3% | -2.5% | -2.5% | -1.9% |
| Italy | 2.1% | -0.2% | 1.5% | 0.6% | -2.8% | -4.7% | -6.1% |
| The Netherlands | 1.0% | 1.5% | 2.3% | 0.1% | -2.6% | -4.0% | -5.2% |
| UK | 0.8% | 2.0% | -1.2% | -0.3% | -3.1% | -5.3% | -5.9% |
| US | 3.2% | 5.6% | 2.2% | 2.5% | 0.1% | -2.6% | -3.8% |
Tom Moeller
AuthorMore in Author Profile »Prior to joining Haver Analytics in 2000, Mr. Moeller worked as the Economist at Chancellor Capital Management from 1985 to 1999. There, he developed comprehensive economic forecasts and interpreted economic data for equity and fixed income portfolio managers. Also at Chancellor, Mr. Moeller worked as an equity analyst and was responsible for researching and rating companies in the economically sensitive automobile and housing industries for investment in Chancellor’s equity portfolio. Prior to joining Chancellor, Mr. Moeller was an Economist at Citibank from 1979 to 1984. He also analyzed pricing behavior in the metals industry for the Council on Wage and Price Stability in Washington, D.C. In 1999, Mr. Moeller received the award for most accurate forecast from the Forecasters' Club of New York. From 1990 to 1992 he was President of the New York Association for Business Economists. Mr. Moeller earned an M.B.A. in Finance from Fordham University, where he graduated in 1987. He holds a Bachelor of Arts in Economics from George Washington University.


