 Global| Jun 08 2005
JOLTS: U.S. Job Openings Firm Further
by:Tom Moeller
|in:Economy in Brief
Summary
The Bureau of Labor Statistics reported that the job openings rate, from the Job Openings & Labor Turnover Survey (JOLTS), firmed to nearly a four year high of 2.7%. The job openings rate is the number of job openings on the last [...]
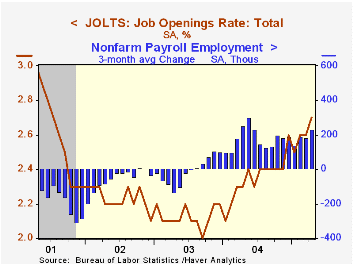
The Bureau of Labor Statistics reported that the job openings rate, from the Job Openings & Labor Turnover Survey (JOLTS), firmed to nearly a four year high of 2.7%. The job openings rate is the number of job openings on the last business day of the month as a percent of total employment plus job openings. The total number of job openings also rose 1.8% m/m (17.8% y/y) after an upwardly revised gain in March.
The hires rate backpedaled to 3.4% from a downwardly revised March level. The hires rate is the number of hires during the month divided by employment.
Job separations were stable, indicated by a separation rate of 3.4%. Total separations include quits, layoffs, discharges, and other separations as well as retirements. The total separations, or turnover, rate is the total number of separations during the month divided by employment.
The survey dates only to December 2000 but has since followed the movement in nonfarm payrolls.
A description of the Jolts survey and the latest release from the U.S. Department of Labor is available here.
| JOLTS (Job Openings & Labor Turnover Survey) | April | March | April '04 | 2004 | 2003 | 2002 |
|---|---|---|---|---|---|---|
| Job Openings Rate: Total | 2.7% | 2.6% | 2.3% | 2.4% | 2.1% | 2.2% |
| Hires Rate: Total | 3.4% | 3.6% | 3.4% | 3.4% | 3.2% | 3.2% |
by Tom Moeller June 8, 2005

Total mortgage applications last week recovered more than all of the prior week's decline and rose 6.5%. Applications began the month 3.5% ahead of the May average which rose 6.5% versus April, according to the Mortgage Bankers Association.
Applications to refinance were quite strong posting a 10.3% w/w increase and began June 9.7% higher than in May which rose 11.2% from April.
Purchase applications rose 3.6% after the prior week's 4.1% decline to begin the month down modestly from May which rose 3.1% from April. During the last ten years there has been a 50% correlation between the y/y change in purchase applications and the change in new plus existing single family home sales.
The effective interest rate on a conventional 30-year mortgage fell to 5.78% from 5.83% the week prior. During only two other weeks this year has the 30 year rate been lower. The effective rate on a 15-year mortgage fell slightly to 5.41%.
The Mortgage Bankers Association surveys between 20 to 35 of the top lenders in the U.S. housing industry to derive its refinance, purchase and market indexes. The weekly survey accounts for more than 40% of all applications processed each week by mortgage lenders. Visit the Mortgage Bankers Association site here.
U.S. Economy: We're All Living on Borrowed Time from William G. Gale and Peter R. Orszag at the Brookings Institution can be found here.
Banking, Markets and Efficiency from the Federal Reserve Bank of New York is available here.
| MBA Mortgage Applications (3/16/90=100) | 06/03/05 | 05/27/05 | Y/Y | 2004 | 2003 | 2002 |
|---|---|---|---|---|---|---|
| Total Market Index | 755.5 | 709.1 | 32.8% | 735.1 | 1,067.9 | 799.7 |
| Purchase | 479.3 | 462.7 | 10.9% | 454.5 | 395.1 | 354.7 |
| Refinancing | 2,362.1 | 2,142.1 | 73.3% | 2,366.8 | 4,981.8 | 3,388.0 |
by Carol Stone June 8, 2005
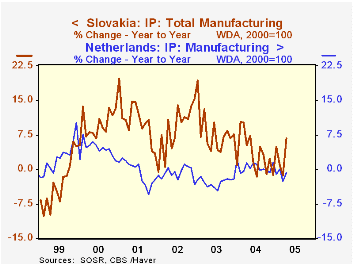
Manufacturing activity advanced in three Euro-Asian nations in April, according to industrial production data published today by national statistical offices. In the Netherlands, manufacturing output gained 1.8%, partially reversing two down months. A generally sluggish pattern has prevailed there, so that April's amount was down 0.7% (working day adjusted) from April 2004. Total industrial output eased in the month by 0.5% as mining activity contracted.
In Slovakia, factory output surged 6% in April, a welcome gain after more than a year of basically no movement. Several diverse industries, especially machinery, textiles and wood products, contributed to the rise. Total industrial production also increased 6% in the month and was 5.5% ahead of a year ago.
For Turkey, a 3.7% rise in manufacturing production for April offset a 4.2% decline in March. Output there has been on a fairly firm uptrend so that year-on-year gains have run 5 to 6% over the past six months and were higher previously. As in Slovakia, a variety of industries are participating in this growth, although in both places, production in specific sectors varies widely from month to month.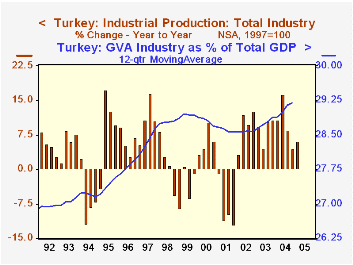
These three countries represent three differing macro-models: the well-developed economy, the emerging economy that's fairly advanced and a more emergent emerging economy. It's intriguing to compare the position of industry within each one. In the Netherlands, industry contributes the smallest portion of the country's gross value added -- about 20%, compared with 26% for Slovakia and 29% for Turkey. Among other contrasts, finance and services come in the reverse order: they total about 25% of GDP in the Netherlands, but 15.5% in Slovakia and a mere 4% in Turkey. One might envision the mature economy as having the largest industrial sector, but on a relative basis, it's the "younger" economy, which is perhaps developing through its emphasis on manufacturing. The movement and trading of goods and services are about midway in the ranking of their contributions to GDP, with support services, such as finance, real estate and other business services coming in last in the younger economy (but first in the mature region). Relative patterns of growth fit this structure as well. Turkey has the most rapid growth rate: about 8% over the past five years, with Slovakia at 5% and the Netherlands just 0.5%-1% recently. This reminds us of the standard product cycle in an individual industry: rapid growth at first that moderates and then plateaus as the market for the product matures. Whole countries, it seems, can behave the same way.
| Industrial Production | Apr 2005 | Mar 2005 | Apr 2004 | 2004 | 2003 | 2002 |
|---|---|---|---|---|---|---|
| Netherlands: 2000 = 100 | 98.5 | 99.0 | 97.8 | 100.2 | 97.7 | 100.1 |
| Manufacturing | 95.7 | 94.0 | 96.9 | 96.2 | 95.8 | 98.5 |
| Mining & Quarrying | 111.4 | 118.6 | 108.7 | 120.2 | 103.8 | 107.1 |
| Slovakia: 2000 = 100 | 131.5 | 124.1 | 124.7 | 124.7 | 120.9 | 114.8 |
| Manufacturing | 142.7 | 134.6 | 133.3 | 134.5 | 129.9 | 120.5 |
| Mining & Quarrying | 84.1 | 86.6 | 90.8 | 94.4 | 105.5 | 111.8 |
| Turkey: 1997 = 100 | 131.1 | 126.5 | 125.0 | 123.4 | 112.4 | 103.4 |
| Manufacturing | 131.1 | 126.4 | 126.1 | 123.7 | 112.1 | 102.5 |
| Mining & Quarrying | 91.4 | 87.7 | 72.4 | 82.6 | 79.4 | 82.0 |

Tom Moeller
AuthorMore in Author Profile »Prior to joining Haver Analytics in 2000, Mr. Moeller worked as the Economist at Chancellor Capital Management from 1985 to 1999. There, he developed comprehensive economic forecasts and interpreted economic data for equity and fixed income portfolio managers. Also at Chancellor, Mr. Moeller worked as an equity analyst and was responsible for researching and rating companies in the economically sensitive automobile and housing industries for investment in Chancellor’s equity portfolio. Prior to joining Chancellor, Mr. Moeller was an Economist at Citibank from 1979 to 1984. He also analyzed pricing behavior in the metals industry for the Council on Wage and Price Stability in Washington, D.C. In 1999, Mr. Moeller received the award for most accurate forecast from the Forecasters' Club of New York. From 1990 to 1992 he was President of the New York Association for Business Economists. Mr. Moeller earned an M.B.A. in Finance from Fordham University, where he graduated in 1987. He holds a Bachelor of Arts in Economics from George Washington University.
More Economy in Brief


