 Global| Apr 11 2006
JOLTS: Openings Steady at Upwardly Revised Level
by:Tom Moeller
|in:Economy in Brief
Summary
The Bureau of Labor Statistics reported that the February job openings rate, from the Job Openings & Labor Turnover Survey (JOLTS), was unchanged from an upwardly revised 2.9% the prior month. The job openings rate is the number of [...]
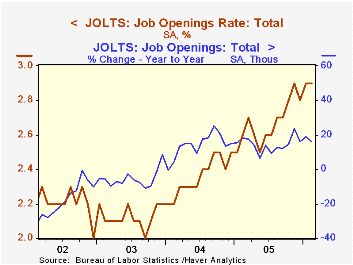
The Bureau of Labor Statistics reported that the February job openings rate, from the Job Openings & Labor Turnover Survey (JOLTS), was unchanged from an upwardly revised 2.9% the prior month. The job openings rate is the number of job openings on the last business day of the month as a percent of total employment plus job openings.
So far this year the job opening rate has averaged 2.9%, up from 2.7% last year, and the actual number of job openings jumped 1.8% to 4.054 million (16.0% y/y) from an upwardly revised January level.
The hires rate held steady m/m at an upwardly revised January level of 3.7%. The hires rate is the number of hires during the month divided by employment. The actual hires level increased 0.6% m/m to 4.972 million (2.9% y/y).
The job separations rate increased to 3.3% after two months at a low 3.2%. Separations include quits, layoffs, discharges, and other separations as well as retirements. The total separations, or turnover, rate is the total number of separations during the month divided by employment. The level of job separations surged 4.8% (0.2% y/y) to 4.492 million.
The survey dates only to December 2000 but has since followed the movement in nonfarm payrolls.
A description of the Jolts survey and the latest release from the U.S. Department of Labor is available here.
What a New Set of Indexes Tells Us About State and National Business Cycles from the Federal Reserve Bank of Philadelphia is available here.
| JOLTS (Job Openings & Labor Turnover Survey) | Feb | Jan | Feb '05 | 2005 | 2004 | 2003 |
|---|---|---|---|---|---|---|
| Job Openings Rate: Total | 2.9% | 2.9% | 2.6% | 2.7% | 2.4% | 2.1% |
| Hires Rate: Total | 3.7% | 3.7% | 3.6% | 3.6% | 3.5% | 3.2% |
by Tom Moeller April 11, 2006
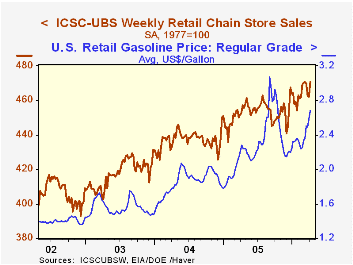
Chain store sales surged last week, according to the International Council of Shopping Centers (ICSC)-UBS survey, as consumers upped spending by 1.8% following five consecutive weeks of softness.
The jump raised sales in early April 0.7% above the March average which rose 0.7% from February.
During the last ten years there has been a 47% correlation between the y/y change in chain store sales and the change in nonauto retail sales less gasoline.
The leading indicator of chain store sales slipped 0.4% (+0.5% /y) after the prior week's 0.5% rise. The March average was unchanged versus February.The ICSC-UBS retail chain-store sales index is constructed using the same-store sales (stores open for one year) reported by 78 stores of seven retailers: Dayton Hudson, Federated, Kmart, May, J.C. Penney, Sears and Wal-Mart.
The rise in store sales last week occurred despite a ten cent increase in retail gasoline prices to $2.68 per gallon. That jump followed a nine cent rise the prior week and raised the April average to $2.64, up 8.7% from $2.43 during March. In spot market trading yesterday gasoline prices rose another seven cents from the prior week's average.
| ICSC-UBS (SA, 1977=100) | 04/08/06 | 04/01/06 | Y/Y | 2005 | 2004 | 2003 |
|---|---|---|---|---|---|---|
| Total Weekly Chain Store Sales | 470.6 | 462.3 | 3.9% | 3.6% | 4.7% | 2.9% |
by Tom Moeller April 11 2006
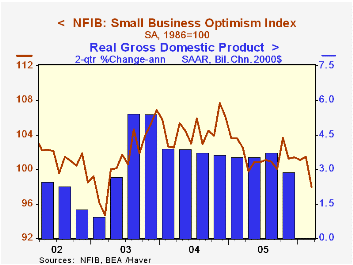
Small business optimism fell 3.4% during March following three consecutive months of sideways movement, according to the National Federation of Independent Business (NFIB). The index drooped last month to its lowest level in three years.
During the last ten years there has been a 70% correlation between the level of the NFIB index and the two quarter change in real GDP.
Expectations that the economy would improve fell to the worst level in five years. The percentage of firms with one or more job openings also reversed recent months' gains and the percentage of firms planning to increase employment fell to the lowest since early 2003.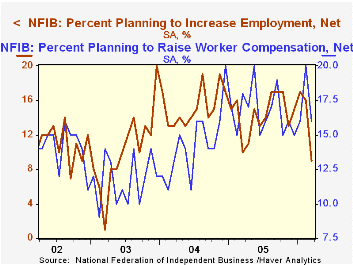
The percent planning to raise capital expenditures fell sharply..The percentage of firms planning to raise average selling prices slipped to 26% while the percentage of firms actually raising prices fell hard to 17%. During the last ten years there has been a 60% correlation between the change in the producer price index and the level of the NFIB price index.
About 24 million businesses exist in the United States. Small business creates 80% of all new jobs in America.
| Nat'l Federation of Independent Business | Mar | Feb | Y/Y | 2005 | 2004 | 2003 |
|---|---|---|---|---|---|---|
| Small Business Optimism Index (1986=100) | 98.0 | 101.5 | -4.4% | 101.6 | 104.6 | 101.3 |
by Louise Curley April 11, 2006
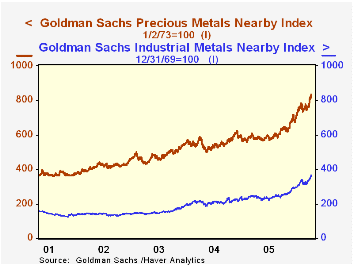
Commodity prices--agricultural, industrial, and precious metals--are exploding.Questions regarding the pros and cons of continued rises in many commodities are beginning to appear in the economic news columns.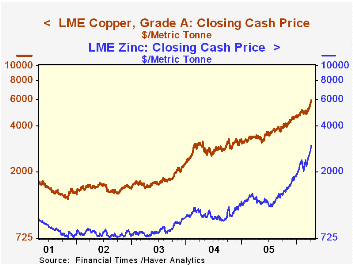
Haver has a wealth of price and related data for tracking the daily movements of several individual commodities and indexes of groups of commodities. Most of the data can be found in the DAILY database under Prices. The data include material from the Commodity Research Bureau, Goldman Sachs, the Wall Street Journal, the Foundation for International Economic Research (FIBER) and the London Metal Exchange.Commodity indexes from the Journal of Commerce, Dow Jones and Standard and Poor's are also available.In addition to the daily data, commodity prices can also be found in the IFS database. These IFS data are monthly.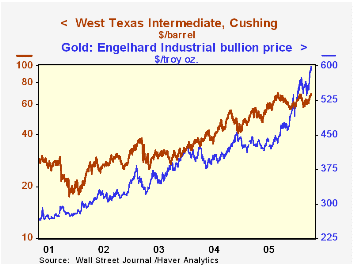
To illustrate the data, we have attached a number of charts. The first chart compares Goldman Sachs's indexes of industrial and precious metals, both of which have been making new highs. (We have based both indexes on a common base January 3, 1978=100). The index of industrial metals has, however, recently gone up faster than the index of precious metals, largely due to the sharp rise in copper and zinc prices.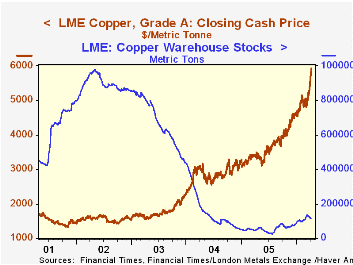
Daily cash prices for agricultural products, industrial metals and precious metals from the Wall Street Journal are found in the DAILY data base. Also found there are spot metal prices from the London Metal Exchange. In addition to prices, the London Metal Exchange provides estimates of the stocks of selected metals. The second chart shows the prices of copper and zinc from the London Metal Exchange and the third chart shows the prices of gold and oil taken from the Wall Street Journal data. Both the second and third charts have been plotted on log scales so that percentage changes in the prices of the two series are comparable. The price of zinc has been rising faster than that of copper and the price of gold has been rising faster than the price of oil in recent days. Over the past year the price of zinc has increased 117% to copper's 69% and the price of gold is up 40%, compared to 33% for oil.
The final chart shows the price of copper on the London Metal Exchange against the estimate of world stocks of the metal. Stocks reached a low of 29,425 metric tons on July 6, 2005. Although they have since recovered, they are still almost 89% below the peak reached in May 2, 2002.
| Commodity Prices and Indexes | 4/10/06 | 4/03/06 | 4/12/05 | W/W % | Y/Y % |
|---|---|---|---|---|---|
| Goldman Sachs | |||||
| Industrial Metals | 342.86 | 336.23 | 239.21 | 1.97 | 43.33 |
| Precious Metals | 382.26 | 366.94 | 256.79 | 4.18 | 48.86 |
| Wall St. Journal | |||||
| Oil West Texas $ per bbl | 68.75 | 66.75 | 51.87 | 3.00 | 32.54 |
| Gold $ per troy oz | 598.90 | 588.15 | 428.68 | 1.83 | 39.71 |
| London Metal Exchange | |||||
| Copper $ per ton | 5920.75 | 5560.50 | 3496.75 | 6.48 | 69.32 |
| Zinc $ per ton | 2965 | 2726.75 | 1368.00 | 8.74 | 117.22 |
| LME Stocks of Metals | Current | Low7/06/05 | Peak5/02/02 | Current from Low | Current from Peak |
| Copper (Metric Tons) | 111,800 | 29,425 | 980,075 | 279.95 | -88.59 |

Tom Moeller
AuthorMore in Author Profile »Prior to joining Haver Analytics in 2000, Mr. Moeller worked as the Economist at Chancellor Capital Management from 1985 to 1999. There, he developed comprehensive economic forecasts and interpreted economic data for equity and fixed income portfolio managers. Also at Chancellor, Mr. Moeller worked as an equity analyst and was responsible for researching and rating companies in the economically sensitive automobile and housing industries for investment in Chancellor’s equity portfolio. Prior to joining Chancellor, Mr. Moeller was an Economist at Citibank from 1979 to 1984. He also analyzed pricing behavior in the metals industry for the Council on Wage and Price Stability in Washington, D.C. In 1999, Mr. Moeller received the award for most accurate forecast from the Forecasters' Club of New York. From 1990 to 1992 he was President of the New York Association for Business Economists. Mr. Moeller earned an M.B.A. in Finance from Fordham University, where he graduated in 1987. He holds a Bachelor of Arts in Economics from George Washington University.
More Economy in Brief


