 Global| Jul 09 2008
JOLTS: May Job Openings Up Minimally - Hires Plunged
by:Tom Moeller
|in:Economy in Brief
Summary
The Bureau of Labor Statistics reported in the Job Openings & Labor Turnover Survey (JOLTS) that for May, the number of job openings rose 0.4% from April. The rise followed April's 1.6% drop after declines during most of the prior [...]
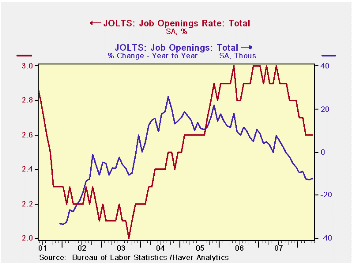
The Bureau of Labor Statistics reported in the Job Openings & Labor Turnover Survey (JOLTS) that for May, the number of job openings rose 0.4% from April. The rise followed April's 1.6% drop after declines during most of the prior twelve months. Since their peak in January of 2007, the number of job openings have fallen 14%.
In addition, the job openings rate during May was unchanged m/m at 2.6%. The latest figures are down from near 3% one year ago. The job openings rate is the number of job openings on the last business day of the month as a percent of total employment plus job openings.
The actual number of job openings in the manufacturing sector fell 3.3% (-31.0% y/y) in May and professional & business services job openings fell 11.1% (-11.2% y/y). Job openings in the education & health sectors also fell but by a more moderate 1.8% (-3.9% y/y) and job openings in retail trade surged 13.3% (7.9% y/y).
By region, openings in the South were weakest, off 19.2% y/y.
In the Midwest openings fell a lesser 5.6% and they were off 8.0% y/y
in the West. In the Northeast job openings also fell 8.0% y/y .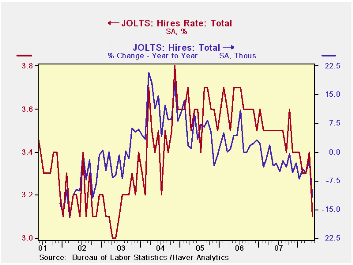
The hires rate plunged to 3.1% from 3.4% in April.The hires rate is the number of hires during the month divided by employment.The latest figure was the lowest since 2003. The actual number of hires plunged 8.8% (-11.8% y/y) and that was the sharpest m/m decline in the series' short record which extends back to 2001. Hires in the trade & transportation sectors fell 11.5% (-20.5% y/y) and construction sector hiring plunged 22.1% (-15.5% y/y).
The job separations rate held stable m/m at 3.2%, down from 3.7% at the peak. Separations include quits, layoffs, discharges, and other separations as well as retirements. The level of job separations fell 3.5% y/y.
The JOLTS survey dates only to December 2000 but has since followed the movement in nonfarm payrolls, though the actual correlation between the two series is low.
A description of the Jolts survey and the latest release from the U.S. Department of Labor is available here.
Bank Lending , Financing Constraints and SME Investment is a working paper from the Federal Reserve Bank of Chicago and it can be found here.
| JOLTS (Job Openings & Labor Turnover Survey) | May | April | May '07 | 2007 | 2006 | 2005 |
|---|---|---|---|---|---|---|
| Job Openings, Total | ||||||
| Rate (%) | 2.6 | 2.6 | 2.9 | 2.8 | 3.0 | 2.8 |
| Total (000s) | 3,626 | 3,612 | 4,133 | 3,974 | 4,272 | 3,863 |
| Hires, Total | ||||||
| Rate (%) | 3.1 | 3.4 | 3.5 | 41.9 | 43.4 | 43.1 |
| Total (000s) | 4,301 | 4,715 | 4,875 | 57,771 | 59,153 | 57,501 |
by Robert Brusca July 9, 2008
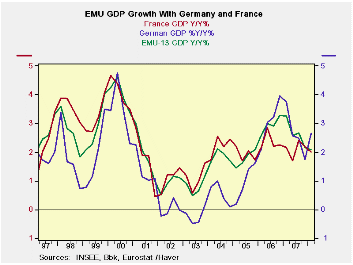
Euro Area GDP grew by 0.7 percent (simple Q/Q rate; also 2.9%
saar) in the first quarter from the fourth quarter, and was up 2.1
percent year on year. The figures show a downward revision to
provisional figures reported on June 3. Eurostat provisionally had put
first quarter growth at 0.8 pct quarter on quarter and 2.2 pct year on
year. The revisions themselves are small and inconsequential but hint
at things to come…
Government can only do so much…
The data in the table below shows that government spending
slowed in Q1 on a Yr/Yr basis but sped up Q/Q. A number of Euro-members
are having to be careful with fiscal outlays and mindful of the
constraint the EC Commission imposes on deficits relative to GDP,
especially as GDP slows. Even a strong quarter’s worth of government
spending did not boost the Yr/Yr result for the sector or maintain GDP
growth overall.
Domestic demand is slowing despite a good quarter
Domestic demand slowed in the zone Yr/Yr but surged in its Q/Q
growth. Here the Yr/Yr trend is more telling since domestic demand has
been tracing out a saw-tooth irregular pattern over the past four
quarters on a Q/Q basis. After posting Yr/Yr quarterly growth rates of
2% or more in recent quarters domestic demand dipped to 1.6% in
2008-Q1. In various EMU surveys the consumer sector continues to come
up as very weak. It has grown at a seemingly stable Yr/Yr pace of 2.1%
for the last two quarters while, in reality, the last two quarters of
growth on a quarterly basis were a very weak minus 0.3% (saar) in
2007-Q4 and a still anemic 0.7% (saar) in 2008-Q1.
Capital spending trends show some resilience but are still
challenged
Capital spending has been erratic as well. But at 2.9% Y/Y it
is only barely the weakest quarter in the past four. In quarterly
growth capital spending surged in Q1 and that may have had more to do
with the good weather than with economics. The surge abuts a very weak
1.6% growth pace for 2007-Q4. Its erratic nature makes its trend hard
to pin down. In surveys of industrial orders, however, it is clear that
the capital goods sector remains the strongest in the euro economy but
even it has begun to lose upward momentum.
Trade softens
Trade continues to augment GDP but its contribution to Q1
growth (Q/Q) was negative as the net export position turned negative
and registered a sharp slowdown from the previous quarter. Export
growth and import growth each made strong gains from the previous
quarter as imports grew faster, but Yr/Yr exports still have the edge
and on that basis trade boosted GDP growth again.
Got recession?
If imports continue to gain on exports as consumer demand is
fading the Euro Area could be challenged to maintain growth. In such an
environment it would be difficult to see capital spending holding up
and the capital goods sector is still the stalwart of the Euro Area.
But capital spending needs a reason and the reason in Europe is fading
as the currency is too strong to support export sales and domestic
demand is faltering, hampering domestic investment. On top of that,
overall world demand is simply slowing. The EMU economy is slowing too
and it is reasonable to ask if it will tip into recession, especially
given the ECB’s overriding concerns about inflation. We may soon see if
the ECB is very serious about its recent cautioning since has noted
that the risks to growth are on the downside. Indeed, they are.
| European GDP EU-15 | ||||||||||
|---|---|---|---|---|---|---|---|---|---|---|
| Consumption | Capital Formation | Trade | Domestic | |||||||
| GDP | Private | Public | Total | X Housing |
Housing | X-M: blns E |
Exports | Imports | Demand | |
| % change Q/Q; X-M is Q/Q change in Blns of euros | ||||||||||
| Q1-08 | 2.9% | 0.7% | 1.8% | 10.2% | 10.9% | 8.4% | -0.1 | 7.9% | 8.3% | 3.0% |
| Q4-07 | 1.5% | -0.3% | 0.6% | 1.6% | 2.0% | 0.6% | 5.8 | 1.7% | -1.0% | 0.3% |
| Q3-07 | 2.6% | 2.1% | 2.3% | 6.3% | 8.1% | 1.4% | -2.4 | 8.4% | 10.0% | 3.1% |
| Q2-07 | 1.4% | 2.5% | 0.9% | -5.9% | -6.2% | -5.2% | 5.9 | 3.9% | 1.1% | 0.2% |
| % change Yr/Yr; X-M is Yr/Yr change in Gap in Blns of euros | ||||||||||
| Q1-08 | 2.1% | 1.2% | 1.4% | 2.9% | 3.5% | 1.2% | 9.2 | 5.5% | 4.5% | 1.6% |
| Q4-07 | 2.2% | 1.2% | 2.0% | 3.9% | 5.5% | -0.1% | 4.4 | 4.4% | 4.0% | 2.0% |
| Q3-07 | 2.7% | 1.8% | 2.5% | 3.0% | 3.7% | 1.0% | 9.2 | 7.1% | 6.1% | 2.2% |
| Q2-07 | 2.6% | 1.8% | 2.3% | 3.3% | 3.8% | 1.7% | 7.8 | 6.0% | 5.2% | 2.2% |
| 5-Yrs | 2.2% | 1.6% | 1.8% | 3.6% | 3.8% | 3.2% | 0.5 | 6.0% | 5.8% | 2.1% |

Tom Moeller
AuthorMore in Author Profile »Prior to joining Haver Analytics in 2000, Mr. Moeller worked as the Economist at Chancellor Capital Management from 1985 to 1999. There, he developed comprehensive economic forecasts and interpreted economic data for equity and fixed income portfolio managers. Also at Chancellor, Mr. Moeller worked as an equity analyst and was responsible for researching and rating companies in the economically sensitive automobile and housing industries for investment in Chancellor’s equity portfolio. Prior to joining Chancellor, Mr. Moeller was an Economist at Citibank from 1979 to 1984. He also analyzed pricing behavior in the metals industry for the Council on Wage and Price Stability in Washington, D.C. In 1999, Mr. Moeller received the award for most accurate forecast from the Forecasters' Club of New York. From 1990 to 1992 he was President of the New York Association for Business Economists. Mr. Moeller earned an M.B.A. in Finance from Fordham University, where he graduated in 1987. He holds a Bachelor of Arts in Economics from George Washington University.
More Economy in Brief


