 Global| Apr 09 2008
JOLTS: Job Openings & Hire Rates Still in Decline
by:Tom Moeller
|in:Economy in Brief
Summary
The Bureau of Labor Statistics reported in the Job Openings & Labor Turnover Survey (JOLTS) that for February, the job openings rate was unchanged from the prior month at 2.7%. The 2008 figures continued down from 2007 and from 2006. [...]
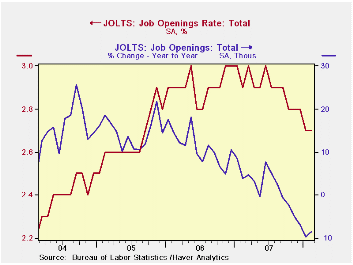
The Bureau of Labor Statistics reported in the Job Openings & Labor Turnover Survey (JOLTS) that for February, the job openings rate was unchanged from the prior month at 2.7%. The 2008 figures continued down from 2007 and from 2006. The job openings rate is the number of job openings on the last business day of the month as a percent of total employment plus job openings.
The actual number of total job openings fell 1.8% m/m to 3.820 million and the number of job openings was down 8.3% from February 2007. Openings in the construction industry were down 40.9% from a year ago and job opening in manufacturing were off 27.9%. Professional & business services job openings were up 10.8% as were job openings in the education & health sectors by 9.4%
By region, openings in the Northeast were down 14.4% y/y and they were down 7.9% in the South. Openings were down 5.7% in the Midwest and by 4.3% in the West.
The hires rate was stable m/m at 3.4% but remained below the
levels of the last several years. The hires rate is the
number of hires during the month divided by employment.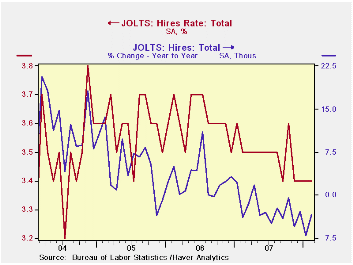
The actual number of hires also was stable m/m at 4.638 million but declined by 3.4% y/y. Hires declined by 2.4% during all of 2007.
The job separations rate ticked up to 3.3% during February but it was stable versus a year ago. Separations include quits, layoffs, discharges, and other separations as well as retirements. The level of job separations fell 0.9% y/y.
The JOLTS survey dates only to December 2000 but has since followed the movement in nonfarm payrolls, though the actual correlation between the two series is low.
A description of the Jolts survey and the latest release from the U.S. Department of Labor is available here.
The minutes to the latest meeting of the Federal Open Market Committee can be found here
Today's speech by Federal Reserve Chairman Ben S. Bernanke titled The Importance of Financial Education and the National Jump Start Coalition Survey are available here.
| JOLTS (Job Openings & Labor Turnover Survey) | February | January | February '07 | 2007 | 2006 | 2005 |
|---|---|---|---|---|---|---|
| Job Openings, Total | ||||||
| Rate (%) | 2.7 | 2.7 | 2.9 | 2.8 | 3.0 | 2.8 |
| Total (000s) | 3,820 | 3,889 | 4,168 | 3,974 | 4,272 | 3,863 |
| Hires, Total | ||||||
| Rate (%) | 3.4 | 3.4 | 3.5 | 41.9 | 43.4 | 43.1 |
| Total (000s) | 4,638 | 4,639 | 4,800 | 57,771 | 59,153 | 57,501 |
by Tom Moeller April 9, 2008
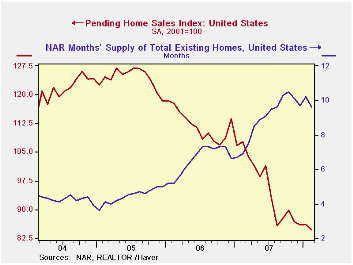
For February, the National Association of Realtors reported that the level of pending sales of existing homes fell 1.9% after having been roughly unchanged in January. The latest reading was as expected and it was down 11.6% from the average sales level in 2007.
These figures are analogous to the new home sales data from the Commerce Department in that they measure existing home sales when the sales contract is signed, not at the time the sale is closed.
On a running basis three month basis, the rate of decline in
home sales eased somewhat to -10.2% (AR) from the worst rate of decline
of over 40% last summer. 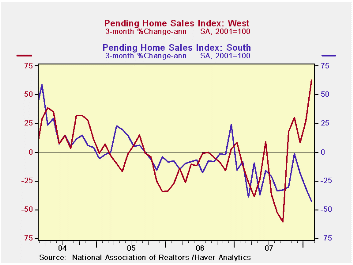
Sales in the West actually have risen 20.7% from their low last August and the three month rate of change through February soared to 62.9%.
That improvement, however, was countered by a sharp deterioration in sales in the South where the three month change in sales fell to a negative 42.7%.
Despite a 3.7% decline in February sales in the Midwest, on a three month basis sales have stabilized and show a slight increase. In the Northeast sales rose 3.2% last month but the three month change remained quite negative at -11.4%.
The Realtors also indicated in an earlier report that the number of homes on the market and available for sale fell 3.0% (+6.0% y/y) in February. At the current sales rate there were 9.6 months of homes on the market versus an 8.9 months average during all of last year.
The pending home sales data are available in Haver's PREALTOR database and the number of homes on the market are in the REALTOR database.
Energy and the Economy from the Federal Reserve Bank of St. Louis is available here.
| Pending Home Sales (2001=100) | February | January | Y/Y | 2007 | 2006 | 2005 |
|---|---|---|---|---|---|---|
| Total | 84.6 | 86.2 | -21.4% | 95.7 | 112.1 | 124.3 |
| Northeast | 71.8 | 69.6 | -25.4 | 85.6 | 98.5 | 108.3 |
| Midwest | 82.7 | 85.9 | -17.4 | 89.6 | 102.0 | 116.4 |
| South | 85.0 | 89.9 | -30.3 | 107.3 | 127.3 | 134.8 |
| West | 95.8 | 93.8 | -6.2 | 92.3 | 109.5 | 128.6 |
by Robert Brusca April 9, 2008
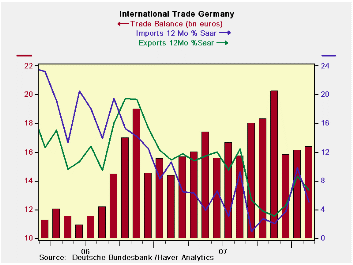
The German trade picture shows a month-to-month slowing imports and flat exports. The slowdown in both the flows may be just monthly volatility or something more ominous. So far Europeans have remained up beat on their economic outlook even as the US economy has slipped. The OECD has held its forecast for 2008 growth for Germany above 2% while the fresh IMF forecast du jour (in fact, of today) cuts German growth by just 0.1% from the IMF’s last guess in January, bringing it to a pace of 1.4%.
The growth rates for exports and imports may be a bit misleading in the table, due to recent volatility. As the chart shows, both exports and imports accelerated from a September low for imports and a November low for exports. Both series have since topped out and growth rates have declined. The trade surplus plunged in December from a high in November but has since begun to edge higher as the pace of both exports and imports has cooled.
In the recent three-month period German imports of capital goods have been surging while German capital goods exports have remained subdued. Capital goods have been the lifeblood of the German economy. Domestically, consumption has just not kicked up. Consumer goods imports are holding steady at around a 6% growth rate while exports of consumer goods have been 20% to 25% over the recent year to three months in terms of annualized rates of growth. For the moment German trade flows appear to be slowing.
| German Trade Trends for Goods | |||||
|---|---|---|---|---|---|
| m/m% | % Saar | ||||
| Feb-08 | Jan-08 | 3M | 6M | 12M | |
| Balance* | €€ 16.37 | €€ 16.10 | €€ 16.09 | €€ 17.48 | €€ 16.83 |
| EXPORTS | |||||
| All Exports | 0.0% | 3.6% | 9.3% | 6.6% | 6.7% |
| Capital Goods | -- | -0.3% | -0.6% | 3.0% | 4.6% |
| Motor Vehicles | -- | -0.3% | 0.8% | -1.0% | 4.2% |
| Consumer Goods | -- | 10.3% | 23.7% | 25.6% | 18.5% |
| IMPORTS | |||||
| All Imports | -0.4% | 4.0% | 41.9% | 6.1% | 5.1% |
| Capital Goods | -- | 5.7% | 11.4% | 13.5% | 7.1% |
| Motor Vehicles | -- | 12.0% | -6.3% | 18.3% | 6.0% |
| Consumer Goods | -- | 3.5% | 6.5% | 4.7% | 6.6% |
| *Bil.Euros; mo or period average; Shaded area trends lag one month | |||||
by Robert Brusca April 9, 2008
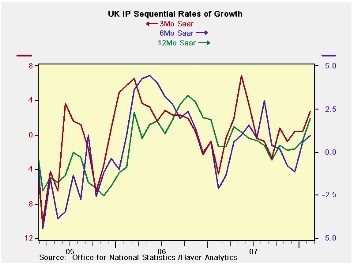
The sequential growth rates for January tell the story compared to their February counterparts: In January year/eayr output growth was 0.7% sliding to an annual rate of 0.6% over six months and to a pace of 0.4% over three months. UK MFG was slow and slowing. Now in February year-over-year growth is 2%, six-month growth still slows, but to 1%, and three-month growth is a solid rebound at 2.7%. Consumer durables are a big reason for the shift with a three-month growth rate up to 19.7% saar. Intermediate goods output is still declining over three months but capital goods output is up a strong 4.8% after being flat over three months in January. The detail shows that much of that rebound is in the volatile auto sector.
Still there is a clear sign of progress. The chart on the left demonstrates that a falling growth pattern has been arrested and features a fledgling upturn of some strength. It may be that the weakness in the pound sterling has something to do with this re-vitalization. Domestic UK spending patterns have not been so strong and confidence continues to slip. If the recovery in output is for real, and not just an artifact of monthly volatility, it is probably the exchange rate at work.
| UK IP and MFG | ||||||||||
|---|---|---|---|---|---|---|---|---|---|---|
| Saar except m/m | Mo/Mo | Feb 08 |
Jan 08 |
Feb 08 |
Jan 08 |
Feb 08 |
Jan 08 |
|||
| UK MFG | Feb 08 |
Jan 08 |
Dec 07 |
3Mo | 3-Mo | 6mo | 6mo | 12mo | 12mo | Q1 Date |
| MFG | 0.4% | 0.5% | -0.2% | 2.7% | 0.4% | 1.0% | 0.6% | 2.0% | 0.7% | 2.3% |
| Consumer | ||||||||||
| Durables | 2.3% | -0.3% | 2.5% | 19.7% | 3.1% | -1.8% | -5.0% | 2.3% | -1.1% | 10.3% |
| Nondurables | 0.3% | 0.3% | -0.5% | 0.4% | -1.2% | -0.2% | -0.4% | 0.5% | -1.3% | 0.4% |
| Intermediate | -0.1% | -0.4% | -0.1% | -2.5% | -3.7% | -0.8% | -1.1% | 0.4% | 0.6% | -3.3% |
| Capital | 0.5% | 0.1% | 0.5% | 4.8% | 0.0% | 3.5% | 2.4% | 3.6% | 2.2% | 2.5% |
| Memo: Detail | 1Mo% | 1Mo% | 1Mo% | 3Mo | 3Mo | 6mo | 6mo | 12mo | 12mo | Q-4 Date |
| Food Drink & Tobacco | 0.6% | 0.4% | -0.5% | 2.0% | 0.4% | 0.8% | -0.8% | 0.1% | -1.8% | 2.1% |
| Textile & Leather | 1.3% | -0.2% | 0.3% | 5.7% | -7.1% | -6.3% | -6.2% | 2.6% | 0.3% | -0.1% |
| Motor Vehicles & Trailer | 2.4% | 1.7% | 1.7% | 19.9% | -3.0% | 2.3% | 2.3% | 2.3% | 5.6% | 5.6% |
| Mining and Quarrying | -1.2% | -4.4% | 1.3% | -16.1% | -20.7% | -10.8% | -11.2% | -6.4% | -3.6% | -21.7% |
| Electricity, Gas & Water | 0.7% | -1.7% | 0.8% | -0.8% | -5.0% | 6.3% | 3.1% | 2.8% | 0.9% | -4.4% |

Tom Moeller
AuthorMore in Author Profile »Prior to joining Haver Analytics in 2000, Mr. Moeller worked as the Economist at Chancellor Capital Management from 1985 to 1999. There, he developed comprehensive economic forecasts and interpreted economic data for equity and fixed income portfolio managers. Also at Chancellor, Mr. Moeller worked as an equity analyst and was responsible for researching and rating companies in the economically sensitive automobile and housing industries for investment in Chancellor’s equity portfolio. Prior to joining Chancellor, Mr. Moeller was an Economist at Citibank from 1979 to 1984. He also analyzed pricing behavior in the metals industry for the Council on Wage and Price Stability in Washington, D.C. In 1999, Mr. Moeller received the award for most accurate forecast from the Forecasters' Club of New York. From 1990 to 1992 he was President of the New York Association for Business Economists. Mr. Moeller earned an M.B.A. in Finance from Fordham University, where he graduated in 1987. He holds a Bachelor of Arts in Economics from George Washington University.
More Economy in Brief


