 Global| Jun 11 2008
JOLTS: April Job Openings & Hires Rose, Trend Down Hard
by:Tom Moeller
|in:Economy in Brief
Summary
The Bureau of Labor Statistics reported in the Job Openings & Labor Turnover Survey (JOLTS) that for April, the number of job openings rose 0.9% from March. That followed declines during most of the prior year. Since their peak in [...]
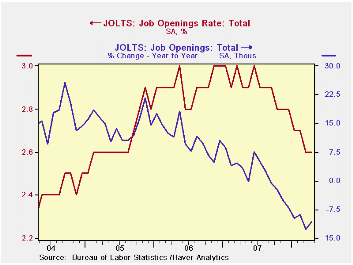
The Bureau of Labor Statistics reported in the Job Openings & Labor Turnover Survey (JOLTS) that for April, the number of job openings rose 0.9% from March. That followed declines during most of the prior year. Since their peak in January of 2007, the number of job openings have fallen 14%. In addition, the job openings rate during that period fell from a 3.0% high to 2.6% in April, unchanged from March. The job openings rate is the number of job openings on the last business day of the month as a percent of total employment plus job openings.
The actual number of job openings in the construction industry was
unchanged in April versus March but the level of openings was down by
more than one-half from the February '07 peak. Job openings in
manufacturing were off by one-third from the late '06 peak while
professional & business services job openings were off 7.9%
from the peak. Job openings in the education & health sectors
were off 8.2% from late '06.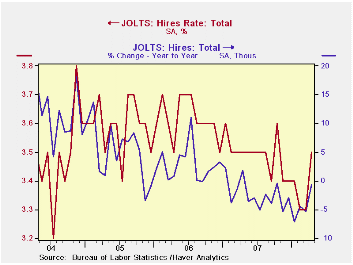
By region, openings in the Northeast were down 23.2% from the late '06 peak and they were down 20.1% in the South. In the Midwest openings were off a lesser 6.9% from the peak and by 15.2% in the West since mid-2007.
The hires rate improved in April to 3.5% versus March but but remained well below the levels of the last several years. The hires rate is the number of hires during the month divided by employment.The actual number of hires rose in April by 4.7% from March after a 2.3% during all of 2007.
The job separations rate was unchanged m/m at 3.2% in April but that was down from 3.7% at the peak. Separations include quits, layoffs, discharges, and other separations as well as retirements. The level of job separations fell 10.3% from the peak.
The JOLTS survey dates only to December 2000 but has since followed the movement in nonfarm payrolls, though the actual correlation between the two series is low.
A description of the Jolts survey and the latest release from the U.S. Department of Labor is available here.
| JOLTS (Job Openings & Labor Turnover Survey) | April | March | April '07 | 2007 | 2006 | 2005 |
|---|---|---|---|---|---|---|
| Job Openings, Total | ||||||
| Rate (%) | 2.6 | 2.6 | 2.9 | 2.8 | 3.0 | 2.8 |
| Total (000s) | 3,705 | 3,672 | 4,148 | 3,974 | 4,272 | 3,863 |
| Hires, Total | ||||||
| Rate (%) | 3.5 | 3.3 | 3.5 | 41.9 | 43.4 | 43.1 |
| Total (000s) | 4,784 | 4,569 | 4,816 | 57,771 | 59,153 | 57,501 |
by Robert Brusca June 11, 2008
 Bad news for the ECB…
France and the EMU ceiling - France’s HICP rate rose by 0.5% in May 2008; its own domestic CPI measure rose by 0.4% with a tempered core of +0.1%. The HICP core rate is not yet available. But both the HICP and the French domestic CPI readings show accelerating headline inflation and that is what the ECB targets and tries to limit. France’s 3.7% Yr/Yr HICP headline gain is nearly DOUBLE the EMU-wide limit of 2% imposed by the ECB. If inflation were to get a ticket for this it would be for reckless driving. If you were driving above the 65mph speed limit to the same degree of excess, you would be traveling at 120mph.
ECB and its inflation ceiling - No wonder the ECB wants to hike rates. The ECB has been below the top of its inflation speed-ceiling in only 4 of the past 49 months. In Sept and Oct of 2005 the pace hit 2.7% and 2.8% Yr/Yr then receded. In May and June of 2006 it hit 2.7% Yr/Yr again, then receded. While many divergences have occurred, for the most part, they had been on the orders of 0.5% or less on a 12-month inflation rate --that is until late 2007. From October to November of 2007 the pace jumped from 2.7% to 3.3%; it rose to 3.6% in April. We await the EMU-wide rate for May.
France’s pressures are getting worse - France’s experience
with inflation seems to be typical rather than unusual for an EMU
nation. The news for May is that things are getting worse. Diffusion
measures on inflation acceleration show that 72% of the domestic French
CPI categories are accelerating over three months compared to six
months using annualized rates. And, over six months compared to Yr/Yr
trends, the acceleration tendency also was greater in 72% of the
categories. Inflation is on a clear widespread rising trend in France
and probably elsewhere in EMU as well.
ECB trying to keep its credibility intact - No wonder the ECB feels is has lost control and wants to hike rates again. Even so, one suspects that there is a lot of ‘hike for show’ not ‘for dough’ in this planned move. The ECB does NOT WANT to choke off growth even though it has no growth mandate. It does not want to send the euro spiraling higher either. It wants to get control of inflation. But it realizes that targeting headline inflation as oil prices rise is a losing game.
Does the ECB have the dilemma of having the WRONG target? The ECB IN FACT cannot control the rate it claims to target, at least not in the short - or even intermediate - run. It can corral it eventually and it can, though anchoring inflation expectations have somewhat better medium term success with the core rate. But that rate has not been made part of the targeting/ceiling process in any way. So viewed in a pure way the ECB is simply blowing it big time. It undoubtedly feels that to regain or maintain credibility it must be seen doing something in the face of this new inflation surge. I conclude that this is a desire to hike rates more ‘for show than for dough’ due to Juergen Startk’s comment this morning that the ECB seeks a rate hike, not a series of hikes. If the ECB wanted to contain inflation here and now it would take a series of hikes and it would also take the onset of recession since the headline overshoot is simply too big to handle with subtlety.
ECB is acting as the Fed would while the Fed has inflation corralled - Despite all the ECB macho rhetoric it is acting more like Fed would in its position. Indeed, the difference is that he Fed informally targets a Core rate of inflation at 2.4% for the CPI and with its core-CPI pace rising by 2.5% Yr/Yr the Fed can claim virtual success despite the headline inflation rate that is worse than the one in Europe. Still, in the US people wonder why target the core when they have to live in the real world and pay headline inflation since everyone uses fuel and food. So even the Fed’s inflation fighting success relative to its soft ‘target’ has not bought it credibility
Policy credibility Vs integrity… It is interesting to ponder
whether credibility/integrity is better served by targeting the
headline rate everyone sees and pays but that you cannot control at all
or the core rate you can influence but will be criticized for having
when a gap opens up between it and headline inflation. In either case
Central banks seem to need some rhetoric (that is lacking) to inform
the public of how their approach will work – to bridge either the
credibility gap (missing the target) or the policy integrity gap
(hitting the wrong one). All we hear from these banks is that they will
not let inflation run wild. Still in the case of the Fed or the ECB in
2008, headline inflation is such that it can hardly be called under
control. While I, as an economist, give both these banks credit for
limiting (so far) the pass-through into core inflation, they are both
lacking in their willingness to get detailed with the public about what
is going on and how their plan will successfully keep inflation in
check. It’s an interesting dilemma. In the case of the ECB it is a
numeric ceiling that has been exceeded nearly every month over the past
four years. In the case of the Fed it’s a vague pledge to control
inflation buttressed by a number that has no formal status and a pledge
to control an inflation rate that people think is not the right one.
France’s May consumer prices report suggests that this dilemma will be
with us for some time.
| France HICP and CPI details | |||||||
|---|---|---|---|---|---|---|---|
| Mo/Mo % | Saar % | Yr/Yr | |||||
| May-08 | Apr-08 | Mar-08 | 3-Mo | 6-Mo | 12-Mo | Yr Ago | |
| HICP Total | 0.5% | 0.1% | 0.5% | 4.6% | 3.8% | 3.7% | 1.1% |
| Core | #N/A | 0.1% | 0.4% | #N/A | #N/A | #N/A | 1.4% |
| CPI | |||||||
| All | 0.4% | 0.1% | 0.5% | 4.0% | 3.5% | 3.3% | 1.1% |
| CPI excl food and energy | 0.1% | 0.2% | 0.3% | 2.5% | 2.2% | 2.3% | 1.3% |
| Food | 0.6% | 0.5% | 0.2% | 5.6% | 6.8% | 6.0% | 0.9% |
| Alcohol | 0.1% | 0.3% | 0.3% | 2.8% | 2.4% | 4.9% | 0.5% |
| Clothing & Shoes | 0.0% | 0.2% | 1.0% | 4.6% | 0.8% | 0.7% | 0.7% |
| Rent & Utilities | 1.0% | 0.2% | 0.3% | 6.3% | 5.6% | 5.6% | 2.1% |
| Health Care | -0.2% | -0.1% | 0.1% | -0.5% | -0.2% | 0.3% | 0.1% |
| Transport | 1.0% | -0.2% | 1.0% | 7.6% | 6.3% | 6.1% | 1.6% |
| Communication | 0.6% | 0.1% | 2.7% | 14.4% | 2.6% | 2.1% | -0.7% |
| Recreation & Culture | -0.1% | -0.4% | 0.0% | -1.7% | -1.9% | -1.6% | -1.9% |
| Education | 0.2% | 0.2% | 0.2% | 2.7% | 3.2% | 3.0% | 2.4% |
| Restaurant & Hotel | 0.2% | 0.2% | 0.4% | 3.5% | 3.4% | 2.9% | 2.8% |
| Other | 0.1% | 0.4% | 0.2% | 3.1% | 1.9% | 1.9% | 2.2% |
| Diffusion | 72.7% | 72.7% | 90.9% | ||||
| Type: | Diffusion: Compared to | 6-mo | 12-mo | Yr-Ago | -- | ||

Tom Moeller
AuthorMore in Author Profile »Prior to joining Haver Analytics in 2000, Mr. Moeller worked as the Economist at Chancellor Capital Management from 1985 to 1999. There, he developed comprehensive economic forecasts and interpreted economic data for equity and fixed income portfolio managers. Also at Chancellor, Mr. Moeller worked as an equity analyst and was responsible for researching and rating companies in the economically sensitive automobile and housing industries for investment in Chancellor’s equity portfolio. Prior to joining Chancellor, Mr. Moeller was an Economist at Citibank from 1979 to 1984. He also analyzed pricing behavior in the metals industry for the Council on Wage and Price Stability in Washington, D.C. In 1999, Mr. Moeller received the award for most accurate forecast from the Forecasters' Club of New York. From 1990 to 1992 he was President of the New York Association for Business Economists. Mr. Moeller earned an M.B.A. in Finance from Fordham University, where he graduated in 1987. He holds a Bachelor of Arts in Economics from George Washington University.
More Economy in Brief


