 Global| May 19 2010
Japan’s IP Growth Rates Level Out And Decay
Summary
Industrial output in Japan soared in March but could not stave off an erosion in the Yr/Yr rate of growth. Output was up by 1.2% m/m across the major sectors. But that followed a result in February that was less than stellar, [...]
Industrial output in Japan soared in March but could not stave off an erosion in the Yr/Yr rate of growth. Output was up by 1.2% m/m across the major sectors. But that followed a result in February that was less than stellar, headlined by a 0.6% drop in IP.
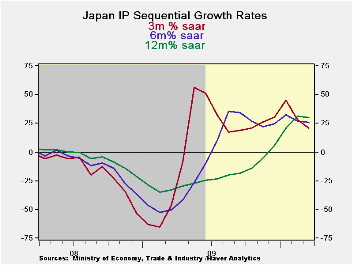
The sequential growth rates in the table show growth at a Yr/Yr pace of 29.9%, a six month annualized pace of 25.6% and a three-month annualized pace of 20.9%. While the growth rates progressively step lower they are still way too elevated to be sustainable. While there is still a lot of slack in Japan’s economy some deceleration in the growth rates is just what the economy needs to keep its expansion on the ‘long track’ which is better than the ‘fast track.’
Yesterday Japan reported its service sector index took a large step back from the previous month’s value. That sort of step back is more worrisome. Japan, the US, and Europe need to drive their respective service sectors to better results. That sector is where the jobs are and that sector has been growing painfully slowly across countries.
Manufacturing continues to do well in the global economy. Japan is farther from making a full recovery that Europe or the US but it is pushing hard on the recovery path. This month’s IP report is a good one.
| Japan Industrial Production Trends | |||||||||
|---|---|---|---|---|---|---|---|---|---|
| m/m % | Saar % | Yr/Yr | Qtr-2 Date %AR |
% 0f Cycle Peak |
|||||
| seas adjusted | Mar 10 |
Feb 10 |
Jan 10 |
3-mo | 6-mo | 12-mo | Yr-Ago | ||
| Mining & MFG | 1.2% | -0.6% | 4.3% | 20.9% | 25.6% | 29.9% | -32.8% | 30.9% | 86.1% |
| Total Industry | 1.2% | -1.1% | 4.6% | 20.3% | 24.9% | 28.9% | -32.0% | 30.5% | 86.5% |
| MFG | 1.2% | -0.6% | 4.3% | 20.9% | 25.6% | 30.0% | -33.0% | 30.9% | 86.1% |
| Textiles | 1.2% | -2.6% | 3.8% | 9.4% | 4.9% | 2.1% | -23.1% | 8.1% | 72.9% |
| T-port | 1.2% | 0.8% | 12.2% | 71.5% | 59.5% | 87.0% | -53.9% | 88.5% | 83.1% |
| Product Group | |||||||||
| Consumer Gds | 3.0% | -3.4% | 0.9% | 1.6% | 8.9% | 20.1% | -24.6% | 4.9% | 87.6% |
| Intermediate Gds | -0.6% | -0.2% | 6.5% | 24.8% | 32.0% | 43.6% | -37.6% | 45.9% | 89.0% |
| Investment Gds | 2.0% | 4.1% | 4.4% | 51.2% | 34.6% | 15.9% | -31.4% | 47.6% | 76.3% |
| Miining | 0.1% | 3.3% | 1.1% | 19.2% | -8.6% | 1.4% | -9.1% | 14.1% | 87.9% |
| Electric&Gas | -0.9% | 2.0% | 2.2% | 14.3% | 20.2% | 7.8% | -7.5% | 19.3% | 94.5% |

Robert Brusca
AuthorMore in Author Profile »Robert A. Brusca is Chief Economist of Fact and Opinion Economics, a consulting firm he founded in Manhattan. He has been an economist on Wall Street for over 25 years. He has visited central banking and large institutional clients in over 30 countries in his career as an economist. Mr. Brusca was a Divisional Research Chief at the Federal Reserve Bank of NY (Chief of the International Financial markets Division), a Fed Watcher at Irving Trust and Chief Economist at Nikko Securities International. He is widely quoted and appears in various media. Mr. Brusca holds an MA and Ph.D. in economics from Michigan State University and a BA in Economics from the University of Michigan. His research pursues his strong interests in non aligned policy economics as well as international economics. FAO Economics’ research targets investors to assist them in making better investment decisions in stocks, bonds and in a variety of international assets. The company does not manage money and has no conflicts in giving economic advice.
More Economy in Brief


