 Global| Apr 30 2009
Japan IP Slows Its Rate Of Decline... In Monthly Trends Only
Summary
There is actually a bounce in output in Japan this month as over MFG output rose by 1.6% in March. That bounce reduced the annual rate of decline of Japan’s output to a pace of -53.1% over three-months. So while the monthly gain seems [...]
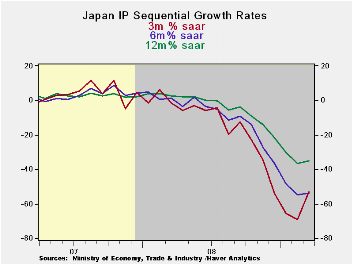
There is actually a bounce in output in Japan this month as
over MFG output rose by 1.6% in March. That bounce reduced the annual
rate of decline of Japan’s output to a pace of -53.1% over
three-months. So while the monthly gain seems impressive it is a gain
amid some pretty colossal losses.
Despite the gain in output this month, a gain that is fairly
widespread, all the sector three-month growth rates are showing an
accelerated rate of decline compared to six month rates (or nearly the
same pace). Even though the bounce is discernable on the chart above
tit has not been strong enough to stabilize any trends in output. Over
the past year output is down a stunning 35%. In the quarter output is
falling at a 63% annual rate.
Still the slight turn up in output at the end of the quarter
could be the start of turning these growth rates higher. The declines
are at such a horrific pace that even this small upturn will make it
likely that Q2 will show a slowing in the pace of the drop. Across
Europe and in the US signs that the pace of contraction is being
reduced are already more manifest than in Japan. Japan may be a
latecomer to this trend but the pickup in monthly IP, despite the fact
that data trends still swamp the gain, shows a significant boost that
could be the start of Japan’s turnaround.
| Japan Industrial Production Trends | ||||||||
|---|---|---|---|---|---|---|---|---|
| m/m % | Saar % | Yr/Yr | Qtr-2-Date | |||||
| seas adjusted | Mar-09 | Feb-09 | Jan-09 | 3-mo | 6-mo | 12-mo | Yr-Ago | % AR |
| mining & MFG | 1.6% | -9.4% | -10.1% | -53.1% | -53.6% | -35.1% | 2.5% | -63.3% |
| Total Industry | 1.3% | -9.1% | -9.3% | -51.5% | -52.3% | -34.0% | 2.5% | -61.6% |
| MFG | 1.7% | -9.2% | -10.3% | -52.8% | -53.4% | -35.0% | 2.7% | -63.3% |
| Textiles | -6.4% | -5.6% | -3.7% | -47.6% | -35.7% | -25.2% | -5.6% | -39.7% |
| T-port | 3.9% | -25.0% | -17.7% | -83.1% | -79.3% | -57.0% | 7.8% | -87.7% |
| Product Group | ||||||||
| Consumer Gds | 1.7% | -9.9% | -6.4% | -45.9% | -45.1% | -27.1% | 2.5% | -56.3% |
| Intermediate Gds | 3.2% | -9.3% | -12.8% | -55.6% | -59.8% | -40.0% | 3.9% | -70.1% |
| Investment Gds | -2.6% | -9.9% | -7.3% | -56.2% | -50.8% | -33.1% | -1.9% | -58.1% |
| Mining | -3.6% | -2.6% | -2.6% | -30.2% | -20.1% | -10.4% | -2.7% | -15.4% |
| Electric&Gas | -0.5% | -3.1% | -0.8% | -16.4% | -13.0% | -7.9% | 0.7% | -20.3% |

Robert Brusca
AuthorMore in Author Profile »Robert A. Brusca is Chief Economist of Fact and Opinion Economics, a consulting firm he founded in Manhattan. He has been an economist on Wall Street for over 25 years. He has visited central banking and large institutional clients in over 30 countries in his career as an economist. Mr. Brusca was a Divisional Research Chief at the Federal Reserve Bank of NY (Chief of the International Financial markets Division), a Fed Watcher at Irving Trust and Chief Economist at Nikko Securities International. He is widely quoted and appears in various media. Mr. Brusca holds an MA and Ph.D. in economics from Michigan State University and a BA in Economics from the University of Michigan. His research pursues his strong interests in non aligned policy economics as well as international economics. FAO Economics’ research targets investors to assist them in making better investment decisions in stocks, bonds and in a variety of international assets. The company does not manage money and has no conflicts in giving economic advice.
More Economy in Brief


