 Global| Feb 02 2007
January Payrolls Missed Forecast, Revisions Upward
by:Tom Moeller
|in:Economy in Brief
Summary
Nonfarm payrolls grew by 111,000, an increase that was short of the Consensus forecast for a 140,000 rise, but the prior two months' gains were upwardly revised by a collective 81,000. The unemployment rate increased last month to [...]
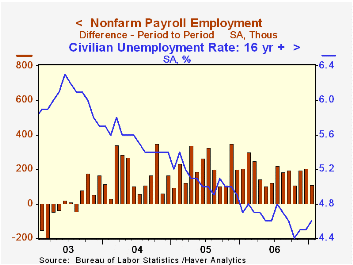
Nonfarm payrolls grew by 111,000, an increase that was short of the Consensus forecast for a 140,000 rise, but the prior two months' gains were upwardly revised by a collective 81,000.
The unemployment rate increased last month to 4.6% from 4.5%. Household employment rose just 31,000 (2.0%) following the 303,000 surge in December, while the labor force grew 199,000 (1.9% y/y). The number of individuals not in the labor force jumped 343,000 and that increase more than reversed the declines in the prior two months. As a result, the labor force participation rate fell to 66.3%.
From the establishment survey, the job gain of 111,000 was the weakest in three months. Private service sector jobs rose just 90,000 (2.0% y/y), held back by a light 4,000 (2.0% y/y) gain in financial sector jobs and an even lighter 3,000 (0.7% y/y) uptick in information services. Professional & business services employment grew 25,000 which was also down from the increases of the last two months (2.9% y/y) and temporary help services jobs rose 5,700 (1.0% y/y) while jobs in retail trade rose just 4,000 (-0.2% y/y).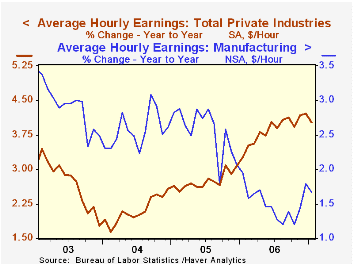
Factory sector payrolls fell again. The 16,000 worker decline was the seventh down month in a row.
Warmer temperatures helped construction employment to rise by 22,000 (1.3% y/y) and the prior month's decline was revised to a 10,00 gain.
Government payrolls increased 14,000 (1.3% y/y) but the prior month's gain was revised down.
Average hourly earnings halved December's gain with a 0.2% increase. Factory sector earnings fell 0.5% (+1.7% y/y) after an upwardly revised 1.0% December gain.
| Employment | January | December | Y/Y | 2006 | 2005 | 2004 |
|---|---|---|---|---|---|---|
| Payroll Employment | 111,000 | 206,000 | 1.6% | 1.9% | 1.7% | 1.1% |
| Manufacturing | -16,000 | -18,000 | -0.8% | -0.2% | -0.6% | -1.3% |
| Average Weekly Hours | 33.8 | 33.9 | 33.8 (Jan. '06) | 33.8 | 33.8 | 33.7 |
| Average Hourly Earnings | 0.2% | 0.4% | 4.0% | 3.9% | 2.8% | 2.1% |
| Unemployment Rate | 4.6% | 4.5% | 4.7% (Jan. '06) | 4.6% | 5.1% | 5.5% |
by Carol Stone February 2, 2007

In January, U.S. sales of light vehicles eased 0.1% from the prior month to 16.73M units, according to the Autodata Corporation. This was 4.6% below January 2006.
There were offsetting moves in trucks and cars. Total truck sales came to 9.04 million, up 4.5% from December and the largest volume of truck sales since 9.11 million last March. Domestic and import trucks gained in about equal proportion.
Car sales, in almost mirror fashion, fell 5.0% in the month and 9.0% from a year ago. Domestic car sales, at 5.12 million lost much of their December increase, down 5.8%; they were down 21.5% from January 2006, but that was an unusually high month. Sales of imported autos were 2.57 million, down 3.4% from December, but up 33.5% from a weak year-ago figure.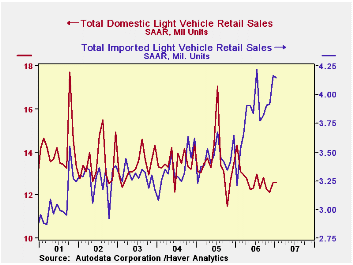
Vehicle sales have been firmer in the last two months and we'd surmise that lower gasoline prices have something to do with that. At the same time, the increase does not carry these sales much above earlier months of 2006, suggesting that consumers remain skittish about prospects for gas prices as 2007 progresses. The fact that import brands tend to be better at fuel-efficient vehicles is seen in the escalating share of imports in the total. Note too that among "domestics", import brands produced in North America also have better sales. In Haver's INDUSTRY database, we tabulate these sales by manufacturer, and market shares of specific companies can be assessed using those data.
| Light Vehicle Sales (SAAR, Mil. Units) | January | December | Y/Y | 2006 | 2005 | 2004 |
|---|---|---|---|---|---|---|
| Total | 16.73 | 16.74 | -4.6% | 16.55 | 16.96 | 16.87 |
| Autos | 7.69 | 8.09 | -9.0% | 7.77 | 7.65 | 7.49 |
| Trucks | 9.04 | 8.65 | -0.5% | 8.78 | 9.32 | 9.37 |
by Carol Stone Qatar's Economy: Oil Industry Fuels Other SectorsFebruary 2, 2007
As announced in Haver's client newsletter, published this past Wednesday, we have added available data to EMERGEMA for additional member countries of the Gulf Cooperation Council (GCC). This group of nations includes the United Arab Emirates, Bahrain, Saudi Arabia, Oman, Qatar and Kuwait, and they formed the GCC some 25 years ago to standardize policies and practices among themselves and to foster unity among their peoples.
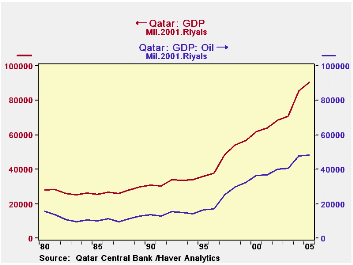
Just this morning, we added nearly 100 new series for Qatar, including national accounts, prices and balance of payments. Most of these are annual and presently run through 2005. A selection of major items is shown in the table below.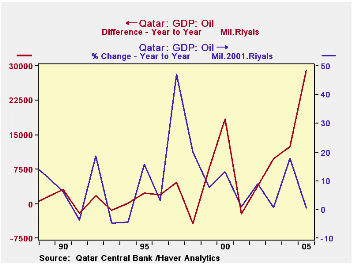
In 2005, Qatar's real GDP totaled 90.7 billion riyals in 2001 prices, equal to just under US$25 billion, at a fixed exchange rate of 3.64 riyals/US$. About half of GDP is generated by the oil industry, but revenues from that sector and other sources seem to be feeding growth elsewhere, as other sectors of the Qatar economy are growing faster. In particular, finance and business services, the second largest industry, expanded significantly in 2004 and 2005. Notably, too, in 2005, the oil industry itself came virtually to a standstill in real terms.
As might be expected, the country has a sizable current account surplus. But the details show an unexpected pattern: through 2005 only the goods account ran a surplus. The country is a net importer of services and net income flows outward. While the former is not especially surprising, the latter is. A priori, we would think that investment income should flood in. Perhaps it does, but repatriated earnings likely flow out. Similarly, transfers, which are mainly workers' remittances, flow out in size as well.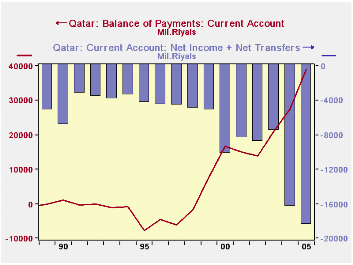 The central bank's balance sheet doesn't have an item specifically called "foreign exchange reserves". But it does show the holdings of deposits in foreign banks and of foreign securities. Not surprisingly, these have expanded. At US$5.3 billion [19.3 billion riyals at 3.64 riyals/US$], they are not large by global standards, but they grew by two-thirds from the end of 2004 through this past November.
| Qatar (Bil.QRiyal) | 2005 | % Chg | 2004 | % Chg | 2003 | % Chg, Ann Rate | 2000 |
|---|---|---|---|---|---|---|---|
| Real GDP (2001 Prices) | 90.7 | 6.1% | 85.5 | 20.8% | 70.8 | 4.6% | 61.8 |
| Oil Industry | 48.0 | 0.6% | 47.8 | 18.0% | 40.5 | 3.5% | 36.5 |
| Finance, Business Services | 8.8 | 17.1% | 7.5 | 37.6% | 5.4 | 4.2% | 4.8 |
| Other Industries | 33.9 | 12.1% | 30.3 | 21.7% | 24.9 | 6.7% | 20.5 |
| Current Account | 39.0 | 27.5 | 20.9 | 16.7 | |||
| Nov 2006 | End 2005 | End 2004 | End 2003 | End 2000 | |||
| Central Bank Foreign Deposits & Security Holdings (Bil.US$)* | |||||||
| $5.3 | $4.5 | $3.2 | $2.7 | $1.1 |

Tom Moeller
AuthorMore in Author Profile »Prior to joining Haver Analytics in 2000, Mr. Moeller worked as the Economist at Chancellor Capital Management from 1985 to 1999. There, he developed comprehensive economic forecasts and interpreted economic data for equity and fixed income portfolio managers. Also at Chancellor, Mr. Moeller worked as an equity analyst and was responsible for researching and rating companies in the economically sensitive automobile and housing industries for investment in Chancellor’s equity portfolio. Prior to joining Chancellor, Mr. Moeller was an Economist at Citibank from 1979 to 1984. He also analyzed pricing behavior in the metals industry for the Council on Wage and Price Stability in Washington, D.C. In 1999, Mr. Moeller received the award for most accurate forecast from the Forecasters' Club of New York. From 1990 to 1992 he was President of the New York Association for Business Economists. Mr. Moeller earned an M.B.A. in Finance from Fordham University, where he graduated in 1987. He holds a Bachelor of Arts in Economics from George Washington University.


