 Global| Mar 18 2008
Italy’s Trade Deficit Widens: Complex Picture Emerges
Summary
Italy’s export and import rise in January and continue to show good momentum despite forecasts of slowing in the Euro Area and a continually rising euro. While MFG readings have showed slowing the export picture remains surprisingly [...]
Italy’s export and import rise in January and continue to show
good momentum despite forecasts of slowing in the Euro Area and a
continually rising euro. While MFG readings have showed slowing the
export picture remains surprisingly strong.
After declines in the year ago period Italy’s exports have
come back to life with strong growth across the export categories.
Capital goods exports remain especially strong. On the import side
growth has also been quite strong. Year over year both export and
imports up by just about 10%.
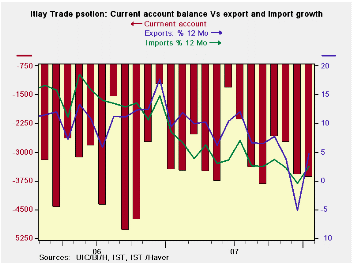
However the chart provides a different perspective. Despite
all the solid growth rates the time series of Yr/Yr growth rates shows
that apart from a sharp drop and recovery over the past year Italy’s
export and import Year-over-year growth rates are still locked in a
broad declining trend.
| Italy's Trade Trends | |||||||
|---|---|---|---|---|---|---|---|
| m/mo % monthly rate | Period Specified saar | ||||||
| Jan-08 | Dec-07 | Nov-07 | 3-Mo | 6-Mo | 12-Mo | Yr-Ago | |
| Current Account Balance | €€ (3,670) | €€ (3,589) | €€ (2,763) | €€ (3,341) | €€ (3,311) | €€ (3,060) | €€ (3,299) |
| Goods Balance | €€ 288 | €€ (1,255) | €€ 455 | €€ (171) | €€ 174 | €€ 171 | €€ (762) |
| Exports | 16.2% | -9.1% | -3.3% | 8.9% | 8.7% | 9.9% | 13.3% |
| Imports | 10.3% | -3.6% | -2.7% | 14.4% | 3.3% | 9.9% | 9.0% |
| Services Balance | €€ 247 | €€ (40) | €€ (415) | €€ (69) | €€ (392) | €€ (476) | €€ (180) |
| Exports | 3.6% | 8.0% | -2.6% | 40.6% | 27.5% | 10.0% | 2.4% |
| Imports | -0.3% | 2.4% | -2.9% | -3.3% | 5.4% | -1.0% | 18.3% |
| Not Seasonally Adjusted | All Yr/Yr | ||||||
| Exports | Jan-08 | Jan-07 | Jan-06 | Jan-05 | |||
| Food & Beverages | 18.3% | -- | -2.0% | -- | 10.9% | -- | 7.2% |
| Capital Goods | 14.2% | -- | 5.3% | -- | 14.4% | -- | 8.8% |
| Transport | 12.1% | -- | -3.1% | -- | 24.0% | -- | 8.5% |
| Consumer Goods | 12.3% | -- | -2.7% | -- | 10.8% | -- | 8.6% |
| Other Goods | 7.2% | -- | 18.1% | -- | 9.2% | -- | 22.6% |
| Imports | Jan-08 | Jan-07 | Jan-06 | Jan-05 | |||
| Food & Beverages | 6.4% | -- | -5.2% | -- | 14.7% | -- | 4.9% |
| Capital Goods | 10.6% | -- | 5.7% | -- | 7.2% | -- | 4.2% |
| Transport | 11.2% | -- | 11.2% | -- | 4.4% | -- | 3.8% |
| Consumer Goods | 8.1% | -- | -1.2% | -- | 18.8% | -- | 2.8% |
| Other Goods | 17.8% | -- | 3.0% | -- | 37.2% | -- | 17.2% |
| Balances in Mil of Euros | |||||||

Robert Brusca
AuthorMore in Author Profile »Robert A. Brusca is Chief Economist of Fact and Opinion Economics, a consulting firm he founded in Manhattan. He has been an economist on Wall Street for over 25 years. He has visited central banking and large institutional clients in over 30 countries in his career as an economist. Mr. Brusca was a Divisional Research Chief at the Federal Reserve Bank of NY (Chief of the International Financial markets Division), a Fed Watcher at Irving Trust and Chief Economist at Nikko Securities International. He is widely quoted and appears in various media. Mr. Brusca holds an MA and Ph.D. in economics from Michigan State University and a BA in Economics from the University of Michigan. His research pursues his strong interests in non aligned policy economics as well as international economics. FAO Economics’ research targets investors to assist them in making better investment decisions in stocks, bonds and in a variety of international assets. The company does not manage money and has no conflicts in giving economic advice.
More Economy in Brief


