 Global| Apr 05 2006
ISM Nonmanufacturing Index Sustained Improvement
by:Tom Moeller
|in:Economy in Brief
Summary
The March Business Activity Index for the non-manufacturing sector inched up to 60.5 from 60.1 during February, reported the Institute for Supply Management (ISM). These levels are much improved versus the low January reading of 56.8 [...]
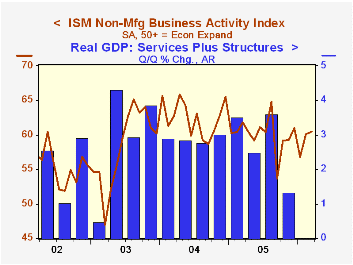
The March Business Activity Index for the non-manufacturing sector inched up to 60.5 from 60.1 during February, reported the Institute for Supply Management (ISM). These levels are much improved versus the low January reading of 56.8 and the latest beat Consensus expectations for a decline to 59.0.
Since the series' inception in 1997 there has been a 53% correlation between the level of the Business Activity Index and the q/q change in real GDP for services plus construction.
The new orders index improved to the highest level this year, though at 59.5 remained below the 2005 average. The employment index backpedaled to 54.6 and so far this year is down slightly from the 2005 average of 55.9. Since the series' inception in 1997 there has been a 60% correlation between the level of the ISM non-manufacturing employment index and the m/m change in payroll employment in the service producing plus the construction industries. 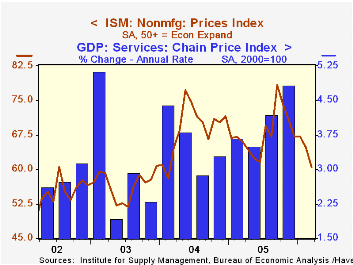
Pricing power fell again and has fallen continually since the series peak last September. Since inception eight years ago, there has been a 70% correlation between the price index and the y/y change in the GDP Services chain price index.
ISM surveys more than 370 purchasing managers in more than 62 industries including construction, law firms, hospitals, government and retailers. The non-manufacturing survey dates only to July 1997, therefore its seasonal adjustment should be viewed tentatively.Business Activity Index for the non-manufacturing sector reflects a question separate from the subgroups mentioned above. In contrast, the NAPM manufacturing sector composite index is a weighted average five components.
"This is Bangalore Calling: Hang Up or Speed Dial? What Technology-Enabled International Trade in Services Means for the U.S. Economy and Workforce from the Federal Reserve Bank of Cleveland can be found here.
| ISM Nonmanufacturing Survey | Mar | Feb | Mar '05 | 2005 | 2004 | 2003 |
|---|---|---|---|---|---|---|
| Business Activity Index | 60.5 | 60.1 | 61.8 | 60.1 | 62.5 | 58.3 |
| Prices Index | 60.5 | 64.8 | 65.9 | 67.9 | 68.8 | 56.6 |
by Tom Moeller April 5, 2006
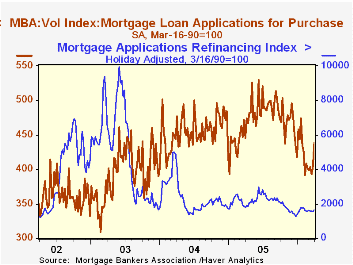
The total number of mortgage applications rose for the second consecutive period. The 7.2% increase last week limited the average decline during March to 1.0% after a 6.3% drop during February.
Purchase applications jumped 8.4% at month end and the average level during March ticked up 0.2% after a 10.2% decline during February.
During the last ten years there has been a 54% correlation between the y/y change in purchase applications and the change in new plus existing single family home sales.
Applications to refinance also recovered with a 5.3% increase last week though the average March level fell 2.4% m/m after a 2.0% February drop.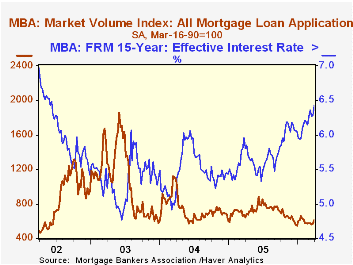
The effective interest rate on a conventional 30-year mortgage rose sharply. The sixteen basis point increase w/w lifted the effective rate to 6.72% and the rate on 15-year financing likewise surged to 6.43%, its highest since June 2002. Interest rates on 15 and 30 year mortgages are closely correlated (>90%) with the rate on 10 year Treasury securities and during the last ten years there has been a (negative) 82% correlation between purchase applications and the effective rate on a 30-Year mortgage.
The Mortgage Bankers Association surveys between 20 to 35 of the top lenders in the U.S. housing industry to derive its refinance, purchase and market indexes. The weekly survey accounts for more than 40% of all applications processed each week by mortgage lenders. Visit the Mortgage Bankers Association site here.
A New Perspective on Policy, yesterday's speech by Dallas Federal Reserve Bank President & CEO Richard W. Fisher, is available here.
| MBA Mortgage Applications (3/16/90=100) | 03/31/06 | 03/24/06 | Y/Y | 2005 | 2004 | 2003 |
|---|---|---|---|---|---|---|
| Total Market Index | 612.8 | 571.7 | -4.9% | 708.6 | 735.1 | 1,067.9 |
| Purchase | 438.2 | 404.1 | -1.7% | 470.9 | 454.5 | 395.1 |
| Refinancing | 1,640.8 | 1,558.4 | -8.8% | 2,092.3 | 2,366.8 | 4,981.8 |
by Carol Stone April 5, 2006
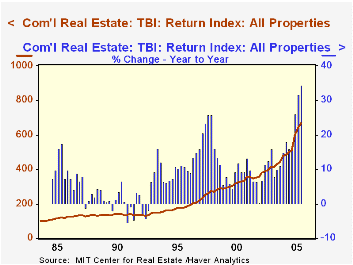
Commercial real estate has increased significantly in importance as an investment medium in recent years. Securitization of commercial mortgage securities and direct interests in portfolios of properties join residential real estate as outlets for capital. But it is complicated to assess the returns on such investments. Each property is sizable and very different from every other property. So, unlike other objects to be priced, there are not simple rules-of-thumb or statistical properties that can be exploited to derive valuations.
Just in mid-February, the Massachusetts Institute of Technology's Center for Real Estate introduced a helpful tool in this process, the Transactions-Based Index. A client brought these new quarterly series to Haver's attention, and they were added to our basic USECON product about two weeks ago.
The Total Return Index shows that commercial real estate holdings earned 34.3% in 2005, following valuation gains of 16.0% in 2004 and 10.0% in 2003. Returns based on price change alone were 29.4% last year, 10.7% in 2004 and 4.2% in 2003.
These figures are weighted indexes for "All Properties", including apartments, industrial buildings, offices and retail centers. Sub-indexes are available for each one of these segments. Retail properties were the strongest in 2005, with a 40.2% total return, while industrial buildings earned "only" 24.2%.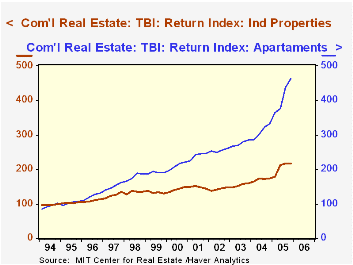
The secret to these indexes is a proprietary database maintained by the National Council of Real Estate Investment Fiduciaries (NCREIF). This group is a trade association of pension funds managers; they collectively own some $200 billion worth of commercial properties numbering about 5,000. Data on pricing and income is taken from actual transactions involving these properties.
Further, since the properties are all distinct, the "average" value of transactions cannot by obtained by simply toting up individual prices and dividing by some appropriate number. The indexes are compiled by appeal to the same kind of weighted "hedonic", quality-adjusting econometric techniques used by BEA and BLS for constructing many of the price indexes used by economists every day. The NCREIF database has been maintained for many years, allowing the MIT econometricians to construct 22 years of history for the "All Property" index and 12 years for the individual property types. A press release and more detailed description of the data are found here on the website of the MIT Center for Real Estate.
| MIT Commercial Real Estate "TBI" Indexes | Q4 2005 | Q3 2005 | Q2 2005 | Year-End|||
|---|---|---|---|---|---|---|
| 2004 | 2003 | 2002 | ||||
| Total Return Index | 668.0 | 638.9 | 601.1 | 497.1 | 428.5 | 389.5 |
| Yr/Yr % Change | 34.3 | 31.8 | 26.0 | 16.0 | 10.0 | 11.5 |
| TBI Price Index | 194.3 | 187.3 | 177.7 | 150.2 | 135.7 | 130.2 |
| Yr/Yr % Change | 29.4 | 26.6 | 20.6 | 10.7 | 4.2 | 4.3 |

Tom Moeller
AuthorMore in Author Profile »Prior to joining Haver Analytics in 2000, Mr. Moeller worked as the Economist at Chancellor Capital Management from 1985 to 1999. There, he developed comprehensive economic forecasts and interpreted economic data for equity and fixed income portfolio managers. Also at Chancellor, Mr. Moeller worked as an equity analyst and was responsible for researching and rating companies in the economically sensitive automobile and housing industries for investment in Chancellor’s equity portfolio. Prior to joining Chancellor, Mr. Moeller was an Economist at Citibank from 1979 to 1984. He also analyzed pricing behavior in the metals industry for the Council on Wage and Price Stability in Washington, D.C. In 1999, Mr. Moeller received the award for most accurate forecast from the Forecasters' Club of New York. From 1990 to 1992 he was President of the New York Association for Business Economists. Mr. Moeller earned an M.B.A. in Finance from Fordham University, where he graduated in 1987. He holds a Bachelor of Arts in Economics from George Washington University.


