 Global| Sep 06 2005
ISM Non-Manufacturing Index Rebounded
by:Tom Moeller
|in:Economy in Brief
Summary
The Institute for Supply Management reported that the Business Activity Index for the non-manufacturing sector rebounded in August from the prior month's decline and jumped 4.5 points to 65.0, the highest level since April of last [...]
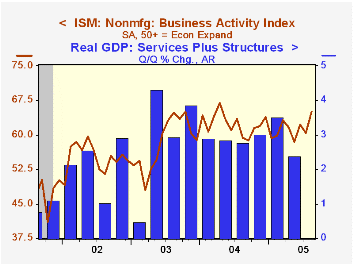
The Institute for Supply Management reported that the Business Activity Index for the non-manufacturing sector rebounded in August from the prior month's decline and jumped 4.5 points to 65.0, the highest level since April of last year. Consensus expectations had been for near stability at 60.
Since the series' inception in 1997 there has been a 50% correlation between the Business Activity Index and the q/q change in real GDP for services plus construction.
Orders rose solidly for the second consecutive month to the highest level in two years and the employment index rose 3.4 points to the highest level since February. Since the series' inception in 1997 there has been a 60% correlation between the level of the ISM non-manufacturing employment index and the m/m change in payroll employment in the service producing plus the construction industries.
Pricing power backpedaled but just a bit. The 3.2 point decline reversed about one third of the jump in July.
ISM surveys more than 370 purchasing managers in more than 62 industries including construction, law firms, hospitals, government and retailers. The non-manufacturing survey dates only to July 1997, therefore its seasonal adjustment should be viewed tentatively.Business Activity Index for the non-manufacturing sector reflects a question separate from the subgroups mentioned above. In contrast, the NAPM manufacturing sector composite index is a weighted average five components.
Survey Says ..., analyzing BLS's employment surveys, from the Federal Reserve Bank of St. Louis is available here.
| ISM Nonmanufacturing Survey | Aug | July | Aug '04 | 2004 | 2003 | 2002 |
|---|---|---|---|---|---|---|
| Business Activity Index | 65.0 | 60.5 | 59.3 | 62.4 | 58.2 | 55.1 |
| Prices Index | 67.1 | 70.3 | 70.1 | 69.0 | 56.8 | 54.0 |
by Louise Curley September 6, 2005
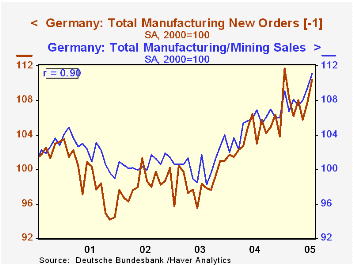
July data on manufacturing sales and new orders for Germany, released today, present a mixed picture. Manufacturing and mining sales in nominal terms to the German domestic market increased 2.28% in July, one of the few times in recent years that the increase in domestic sales was greater than that of foreign sales, which were up only 0.49%. The trend in new orders, however, suggests that stepped up growth in domestic sales and the deceleration of foreign sales growth may be short lived. Domestic new orders declined by 0.29%. in July while foreign new orders rose sharply--8.24%.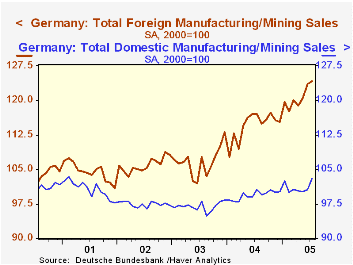
New orders and sales are obviously closely related as shown in the first chart which plots total sales and new orders lagged one month. The correlation between the two series is .90. The second and third charts, contrast foreign and domestic sales and foreign and domestic new orders. Domestic new orders and sales have shown little growth over the past five years. Foreign orders and sales have shown a good upward trend since 2003 in spite of a rise in the Euro over much of this period until recently. Growth in the manufacturing industry is Germany is still highly dependent on foreign demand.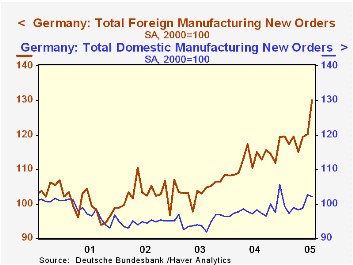
| Manufacturing New Orders and Sales (2000=100) | Jul 05 | Jun 05 | Jul 04 | M/M % | Y/Y % | 2004 | 2003 | 2002 |
|---|---|---|---|---|---|---|---|---|
| New Orders Total Nominal | 114.6 | 110.4 | 105.8 | 3.80 | 8.32 | 104.8 | 98.9 | 98.2 |
| Domestic | 102.2 | 102.5 | 98.3 | -0.29 | 3.97 | 98.3 | 94.6 | 94.6 |
| Foreign | 130.1 | 120.2 | 115.1 | 8.24 | 13.03 | 112.9 | 104.3 | 102.5 |
| Sales, Manufacturing & Mining | ||||||||
| Total | 111.1 | 109.5 | 106.9 | 1.46 | 3.93 | 105.2 | 100.7 | 100.7 |
| Domestic | 103.0 | 100.7 | 100.6 | 2.28 | 2.39 | 99.4 | 96.9 | 97.4 |
| Foreign | 124.2 | 123.6 | 117.1 | 0.49 | 6.06 | 114.5 | 106.7 | 106.0 |

Tom Moeller
AuthorMore in Author Profile »Prior to joining Haver Analytics in 2000, Mr. Moeller worked as the Economist at Chancellor Capital Management from 1985 to 1999. There, he developed comprehensive economic forecasts and interpreted economic data for equity and fixed income portfolio managers. Also at Chancellor, Mr. Moeller worked as an equity analyst and was responsible for researching and rating companies in the economically sensitive automobile and housing industries for investment in Chancellor’s equity portfolio. Prior to joining Chancellor, Mr. Moeller was an Economist at Citibank from 1979 to 1984. He also analyzed pricing behavior in the metals industry for the Council on Wage and Price Stability in Washington, D.C. In 1999, Mr. Moeller received the award for most accurate forecast from the Forecasters' Club of New York. From 1990 to 1992 he was President of the New York Association for Business Economists. Mr. Moeller earned an M.B.A. in Finance from Fordham University, where he graduated in 1987. He holds a Bachelor of Arts in Economics from George Washington University.
More Economy in Brief


