 Global| Mar 03 2005
ISM Non-Manufacturing Index Higher
by:Tom Moeller
|in:Economy in Brief
Summary
The Institute for Supply Management reported that the February Business Activity Index for the non-manufacturing sector rose to 59.8 from 59.2 the prior month. Consensus expectations had been for a decline to 57.0. Since the series' [...]
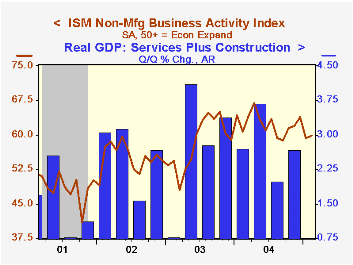
The Institute for Supply Management reported that the February Business Activity Index for the non-manufacturing sector rose to 59.8 from 59.2 the prior month. Consensus expectations had been for a decline to 57.0.
Since the series' inception in 1997 there has been a 50% correlation between the Business Activity Index and the q/q change in real GDP for services plus construction.
The employment sub index jumped 7.4 points to a record high. Since the series' inception in 1997 there has been a 60% correlation between the level of the ISM non-manufacturing employment index and the m/m change in payroll employment in the service producing plus the construction industries.
The new orders index rose to 61.6, the high end of a tight range held for the last year.
Pricing power eased a bit m/m to the lowest level in nearly a year.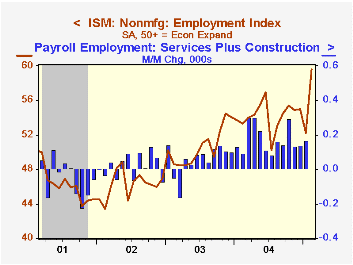
Business Activity Index for the non-manufacturing sector reflects a question separate from the subgroups mentioned above. In contrast, the NAPM manufacturing sector composite index is a weighted average five components.
Financial Market Developments and Economic Activity during Current Account Adjustments in Industrial Economies from the Board of Governors of the Federal Reserve System is available here.
| ISM Nonmanufacturing Survey | Feb | Jan | Feb '04 | 2004 | 2003 | 2002 |
|---|---|---|---|---|---|---|
| Business Activity Index | 59.8 | 59.2 | 60.8 | 62.4 | 58.2 | 55.1 |
| Prices Index | 66.4 | 66.6 | 58.0 | 69.0 | 56.8 | 54.0 |
by Tom Moeller March 3, 2005
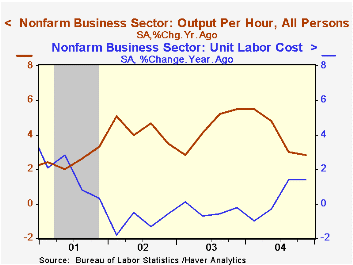
Non-farm labor productivity growth for 4Q04 was revised upward to 2.1%, reflecting an upward revision to output growth. Nevertheless, productivity growth for the full year of 4.0% was the lowest since 2001. The late year slowdown reduced 4Q/4Q growth to 2.8%. Consensus expectations had been for a revision to 1.4% growth for 4Q. Figures were revised back to 2000.
Output growth was revised up as expected to 3.7% (4.4% y/y) from 2.8% and reflected an accounting for higher exports to Canada. Growth in hours worked was revised down to 1.6% from 1.9%.
The upward revision to productivity lowered the estimate of unit labor cost growth to 1.3% from 2.3%. Annual growth of 0.4% followed two years of decline. Compensation growth was revised up to 3.4% (4.2% y/y) from 3.1%.
Productivity in the manufacturing sector was revised slightly higher to 5.8% (5.2% y/y) from 5.6%. Unit labor cost growth in the factory sector held at 0.4% (-0.5% y/y) but compensation growth was revised up.
International Risk-Sharing and the Transmission of Productivity Shocks from the Board of Governors of the Federal Reserve System is available here.
| Non-farm Business Sector (SAAR) | 4Q '04 (Revised) | 4Q '04 (Prelim.) | 3Q '04 | Y/Y | 2004 | 2003 | 2002 |
|---|---|---|---|---|---|---|---|
| Output per Hour | 2.1% | 0.8% | 1.3% | 2.8% | 4.0% | 4.4% | 4.3% |
| Compensation | 3.4% | 3.1% | 5.4% | 4.2% | 4.4% | 4.0% | 3.2% |
| Unit Labor Costs | 1.3% | 2.3% | 4.0% | 1.4% | 0.4% | -0.4% | -1.1% |
by Tom Moeller March 3, 2005
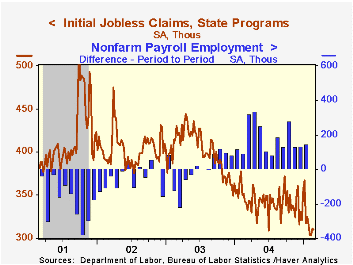
Initial claims for unemployment insurance slipped 1,000 to 310,000 last week and the prior week's moderate rise was lessened. Consensus expectations had been for 315,000 claims.
The four week moving average of initial claims fell to 307,0000 (-13.6% y/y).
Continuing claims for unemployment insurance rose 12,000 and the prior week's decline was lessened to 52,000.
During the last ten years there has been a (negative) 75% correlation between the level of initial claims for unemployment insurance and the monthly change in payroll employment. There has been a (negative) 66% correlation with the level of continuing claims.
The insured rate of unemployment remained at 2.1%.
| Unemployment Insurance (000s) | 02/26/05 | 02/19/05 | Y/Y | 2004 | 2003 | 2002 |
|---|---|---|---|---|---|---|
| Initial Claims | 310 | 311 | -9.4% | 343 | 402 | 404 |
| Continuing Claims | -- | 2,650 | -15.8% | 2,926 | 3,531 | 3,570 |

Tom Moeller
AuthorMore in Author Profile »Prior to joining Haver Analytics in 2000, Mr. Moeller worked as the Economist at Chancellor Capital Management from 1985 to 1999. There, he developed comprehensive economic forecasts and interpreted economic data for equity and fixed income portfolio managers. Also at Chancellor, Mr. Moeller worked as an equity analyst and was responsible for researching and rating companies in the economically sensitive automobile and housing industries for investment in Chancellor’s equity portfolio. Prior to joining Chancellor, Mr. Moeller was an Economist at Citibank from 1979 to 1984. He also analyzed pricing behavior in the metals industry for the Council on Wage and Price Stability in Washington, D.C. In 1999, Mr. Moeller received the award for most accurate forecast from the Forecasters' Club of New York. From 1990 to 1992 he was President of the New York Association for Business Economists. Mr. Moeller earned an M.B.A. in Finance from Fordham University, where he graduated in 1987. He holds a Bachelor of Arts in Economics from George Washington University.
More Economy in Brief


