 Global| May 01 2007
ISM: Keeping up with the Joneses…
Summary
Periodically I run the table below just to see if people are awake. But seriously The table contains a wealth of data on the ISM and what it is doing. The percentile and % of average columns at the right of the table put the raw [...]
Periodically I run the table below just to see if people are awake. But seriously…
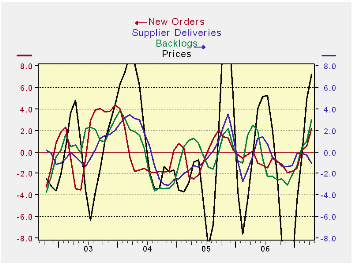
The table contains a wealth of data on the ISM and what it is doing. The ‘percentile’ and ‘% of average’ columns at the right of the table put the raw monthly readings (which are on the far left) in the perspective of their normal variation. Whatever you think of the ISM at 54.7, it is in the 62nd percentile of its range of values for actual experience since Mid-1999. New orders and order back logs are also in their 60th percentiles or more. Unfortunately, prices, at a reading of 73, are in the top 23 percentile of all readings for this period (percentile 77th). But employment has turned a corner in April with a diffusion reading of 53.1 that places it in the 71st percentile of its range. The ISM for April looks a lot stronger than anyone had expected - from the headline down through the components. And there is more good news… the components that are mostly leading components such as orders, backlogs and prices are cycling higher with 3-month averages trending above 6-month averages. Still, supplier deliveries are lagging as we saw in some regional reports. Supplier deliveries are supposed to track with price pressures and recently delivery speeds have speeded up - a sign of more slack while prices have spurted - usually a sign of less slack. We might be tempted to chalk prices up to energy spurting but clear improvement in activity indexes discourages that conclusion.
Another anomaly in this report is the weakness in the PMI relative to the import reading. Both production and the PMI itself tend to score higher values than the import reading. But since 2005, imports have scored as high or higher and this is with a weakening dollar in the mix. It is hard to believe that import penetration has increased noticeably during this period, but maybe it has. Certainly Japan could be factor in that regard since the yen has been contrarily weak and we know Japanese automakers have taken advantage of the situation.
Finally I offer the chart below which does NOT plot data from the ISM. This plot draws from the HAVER database on regional PMI surveys and the lot is only up to date through March. But it makes a point I want to make and it is a point beyond just the April data. The chart above plots several different PMI data types by converting each survey to a reading that reflects the index’s position in its range of values since April of 1995. So no matter what the index, we can plot it on one graph with the others in a consistent fashion. The indexes are the Chicago national activity index which is a broad index not just of MFG activity, the Chicago Mid-West MFG index, the Mid-America States index and the Mountain States index. I chose these from the available MFG and activity surveys because they are for different groupings of states. And the point right now that various blocks of states are doing very differently economically. For some it’s hard to ‘keep up with the Joneses’; others ‘are the Joneses’.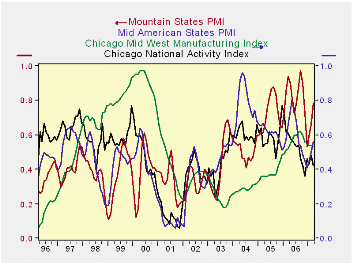
The Mountain States, while the most volatile, are also the states with the strongest readings. Until mid-1996 the Chicago MFG index was heading steadily higher as well. In contrast, the Chicago national activity index and the Mid-America States index are each trending lower, since about 2004. Now, new trends are in the making, the Mountain States and Mid America States are showing rebound with national activity index and the Chicago Mid-West MFG index flat to slightly lower.
Different parts of the country are locked in different medium-term trends and are experiencing different short-term trends as well.
We have recently seen a revival of MFG orders from the durable goods report. The ISM is now up in April. Consumer confidence, while off peak, is not unraveling as we saw with the upward revision to the April U of M sentiment index. But energy prices are up again and sub-prime lending problems - that have been blown out of proportion - clearly weigh on the home-owning public.
But, by and large, what we can see seems to represent a creeping improvement in the MFG sector for an economy where the services sector has remained firm all along. There are hints of less weakness in construction to go along with all this. Income growth in March was strong. There is every reason to expect US manufacturers will be able to put problems behind them now that the dollar is lower and inventories have been reduced. Problems have causes and solutions. The fact of the past weakness in US MFG is that US firms have used the time to get better prepared to re-balance inventories with sales. With the special declines in sectors that sapped strength from GDP largely out of the way, we are prepared to see growth show though instead of the pessimism that is heralded by other economists who want to extrapolate trends instead of seeing the trappings of rebuilding or of turning points in the making.
The spottiness in the regional indexes reveals the mixed nature the economy. It also results in some instability in the national index depending on which region’s tug is the greatest month-to-month. This unevenness is a sign of an economy in transition. I think this has been transition for the positive, not a preparation for an even greater negative ahead as some others think. Some slowdowns prove to be a pause that refreshes instead of a prelude to decline. The incoming data will help us decide which scenario is correct.
| since Jun-99 | ||||||||||
| ISM | Current | Last Month | Std Dev | Average | SD%Avg | MAX | MIN | Range | Percentile | % of AVG |
| PM Index | 54.7 | 50.9 | 5.3 | 53.2 | 10.0 | 63.2 | 40.5 | 22.7 | 62.6 | 103 |
| New Orders | 58.5 | 51.6 | 6.7 | 55.8 | 12.0 | 71.3 | 38.4 | 32.9 | 61.1 | 105 |
| Backlogs | 54.5 | 47.0 | 6.6 | 50.7 | 13.0 | 66.5 | 36.0 | 30.5 | 60.7 | 108 |
| Production | 57.3 | 53.0 | 6.3 | 55.6 | 11.4 | 70.0 | 38.6 | 31.4 | 59.6 | 103 |
| Supplier Deliveries | 50.2 | 51.3 | 5.0 | 54.2 | 9.2 | 68.1 | 45.4 | 22.7 | 21.1 | 93 |
| Inventories | 46.3 | 47.5 | 3.9 | 45.8 | 8.6 | 53.6 | 37.1 | 16.5 | 55.8 | 101 |
| Prices(Pd) | 73.0 | 65.5 | 12.6 | 62.3 | 20.3 | 88.0 | 32.0 | 56.0 | 73.2 | 117 |
| Employment | 53.1 | 48.7 | 5.9 | 49.3 | 12.1 | 60.3 | 35.1 | 25.2 | 71.4 | 108 |
| New Export Orders | 57.0 | 55.5 | 3.5 | 53.7 | 6.6 | 60.2 | 44.3 | 15.9 | 79.9 | 106 |
| Import Orders | 58.0 | 57.5 | 3.6 | 54.7 | 6.7 | 61.5 | 46.9 | 14.6 | 76.0 | 106 |
| Avg Days Lead For: | Since Jun 1999 | |||||||||
| Production Material | 46.0 | 45.0 | 3.2 | 47.1 | 6.9 | 55.0 | 38.0 | 17.0 | 47.1 | 98 |
| Capital Expenditure | 115.0 | 110.0 | 8.6 | 107.0 | 8.1 | 120.0 | 86.0 | 34.0 | 85.3 | 107 |
| Maint., Repair, & Ops | 25.0 | 22.0 | 2.1 | 22.5 | 9.5 | 29.0 | 17.0 | 12.0 | 66.7 | 111 |
| Note: From April 1991 to Date; except back logs since Jan 1993 | ||||||||||

Robert Brusca
AuthorMore in Author Profile »Robert A. Brusca is Chief Economist of Fact and Opinion Economics, a consulting firm he founded in Manhattan. He has been an economist on Wall Street for over 25 years. He has visited central banking and large institutional clients in over 30 countries in his career as an economist. Mr. Brusca was a Divisional Research Chief at the Federal Reserve Bank of NY (Chief of the International Financial markets Division), a Fed Watcher at Irving Trust and Chief Economist at Nikko Securities International. He is widely quoted and appears in various media. Mr. Brusca holds an MA and Ph.D. in economics from Michigan State University and a BA in Economics from the University of Michigan. His research pursues his strong interests in non aligned policy economics as well as international economics. FAO Economics’ research targets investors to assist them in making better investment decisions in stocks, bonds and in a variety of international assets. The company does not manage money and has no conflicts in giving economic advice.
More Economy in Brief


