 Global| Oct 01 2007
ISM Index Slightly Weaker
by:Tom Moeller
|in:Economy in Brief
Summary
The Composite Index of activity in the manufacturing sector, reported by the Institute of Supply Management (ISM), fell slightly last month to 52.0 from 52.9 during August. A reading above 50 indicates growth in factory sector [...]
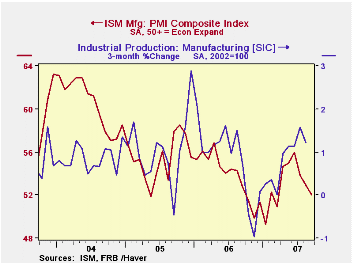
The Composite Index of activity in the manufacturing sector, reported by the Institute of Supply Management (ISM), fell slightly last month to 52.0 from 52.9 during August. A reading above 50 indicates growth in factory sector activity. Consensus expectations had been for a reading of 52.5.
During the last twenty years there has been a 64% correlation between the level of the Composite Index and the three month growth in factory sector industrial production.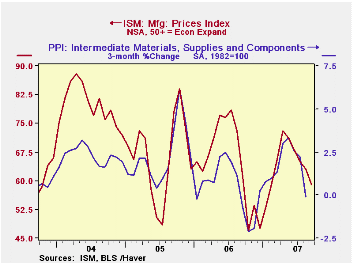
It is appropriate to correlate the ISM index level with factory sector growth because the ISM index is a diffusion index. It measures growth by being constructed using all of the absolute positive changes in activity added to one half of the no change in activity measures.
Declines in three of the index's five components accounted for the lower composite index. New orders fell for the third consecutive month. The 1.9 point drop left the index at its lowest since level since March. The production component fell for the second month in the last three. The drop in the inventories component was the last component moving down. The 3.8 point decline was to the lowest level since January.
Moving up was the employment index. The modest 0.4 point uptick, however, only recouped a piece of earlier declines. During the last twenty years there has been a 67% correlation between the level 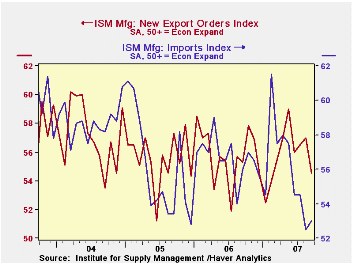 of the ISM employment Index and the three month growth in factory sector employment. Finally, the 1.9 point rise in the supplier delivery index reversed about all of the sharp decline during August.
The index of new export orders moved lower. The sharp 2.5 point decline during August left the index at its lowest level since March. The import index, on the other hand, rose slightly but only reversed a bit of the huge declines earlier this year.
The prices index moved lower again, to its lowest level since January. Just 30% of the respondents reported an ability to raise prices. During the last twenty years there has been a 77% correlation between the price index and the three month change in the PPI for intermediate goods.
Systemic Risk and the International Lender of Last Resort is a speech by Federal Reserve Board Governor Frederic S. Mishkin and it is available here.
| September | August | September '06 | 2006 | 2005 | 2004 | |
|---|---|---|---|---|---|---|
| Composite Index | 52.0 | 52.9 | 52.7 | 53.9 | 55.5 | 60.5 |
| New Orders Index | 53.4 | 55.3 | 54.2 | 55.4 | 57.4 | 63.5 |
| Prices Paid Index (NSA) | 59.0 | 63.0 | 61.0 | 65.0 | 66.4 | 79.8 |

Tom Moeller
AuthorMore in Author Profile »Prior to joining Haver Analytics in 2000, Mr. Moeller worked as the Economist at Chancellor Capital Management from 1985 to 1999. There, he developed comprehensive economic forecasts and interpreted economic data for equity and fixed income portfolio managers. Also at Chancellor, Mr. Moeller worked as an equity analyst and was responsible for researching and rating companies in the economically sensitive automobile and housing industries for investment in Chancellor’s equity portfolio. Prior to joining Chancellor, Mr. Moeller was an Economist at Citibank from 1979 to 1984. He also analyzed pricing behavior in the metals industry for the Council on Wage and Price Stability in Washington, D.C. In 1999, Mr. Moeller received the award for most accurate forecast from the Forecasters' Club of New York. From 1990 to 1992 he was President of the New York Association for Business Economists. Mr. Moeller earned an M.B.A. in Finance from Fordham University, where he graduated in 1987. He holds a Bachelor of Arts in Economics from George Washington University.
More Economy in Brief


