 Global| Oct 01 2007
ISM Index Slightly Weaker
by:Tom Moeller
|in:Economy in Brief
Summary
The Composite Index of activity in the manufacturing sector, reported by the Institute of Supply Management (ISM), fell slightly last month to 52.0 from 52.9 during August. A reading above 50 indicates growth in factory sector [...]
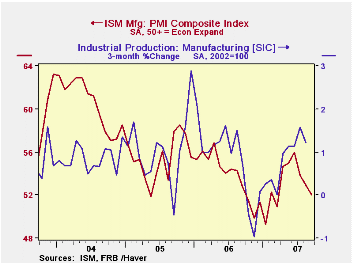
The Composite Index of activity in the manufacturing sector, reported by the Institute of Supply Management (ISM), fell slightly last month to 52.0 from 52.9 during August. A reading above 50 indicates growth in factory sector activity. Consensus expectations had been for a reading of 52.5.
During the last twenty years there has been a 64% correlation between the level of the Composite Index and the three month growth in factory sector industrial production.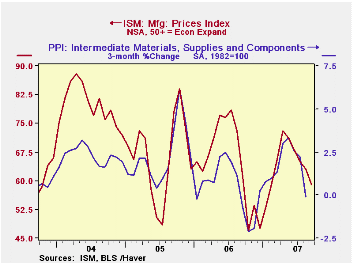
It is appropriate to correlate the ISM index level with factory sector growth because the ISM index is a diffusion index. It measures growth by being constructed using all of the absolute positive changes in activity added to one half of the no change in activity measures.
Declines in three of the index's five components accounted for the lower composite index. New orders fell for the third consecutive month. The 1.9 point drop left the index at its lowest since level since March. The production component fell for the second month in the last three. The drop in the inventories component was the last component moving down. The 3.8 point decline was to the lowest level since January.
Moving up was the employment index. The modest 0.4 point uptick, however, only recouped a piece of earlier declines. During the last twenty years there has been a 67% correlation between the level 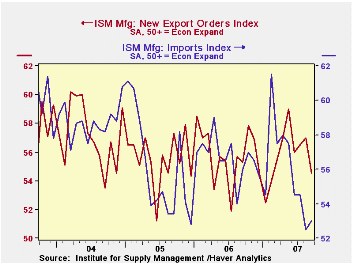 of the ISM employment Index and the three month growth in factory sector employment. Finally, the 1.9 point rise in the supplier delivery index reversed about all of the sharp decline during August.
The index of new export orders moved lower. The sharp 2.5 point decline during August left the index at its lowest level since March. The import index, on the other hand, rose slightly but only reversed a bit of the huge declines earlier this year.
The prices index moved lower again, to its lowest level since January. Just 30% of the respondents reported an ability to raise prices. During the last twenty years there has been a 77% correlation between the price index and the three month change in the PPI for intermediate goods.
Systemic Risk and the International Lender of Last Resort is a speech by Federal Reserve Board Governor Frederic S. Mishkin and it is available here.
| September | August | September '06 | 2006 | 2005 | 2004 | |
|---|---|---|---|---|---|---|
| Composite Index | 52.0 | 52.9 | 52.7 | 53.9 | 55.5 | 60.5 |
| New Orders Index | 53.4 | 55.3 | 54.2 | 55.4 | 57.4 | 63.5 |
| Prices Paid Index (NSA) | 59.0 | 63.0 | 61.0 | 65.0 | 66.4 | 79.8 |
by Robert Brusca October 1, 2007
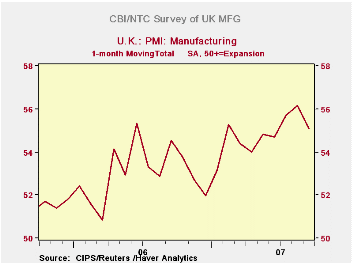
The UK manufacturing sector was weaker than expected in September but output price pressures rose to a record high, according to the latest Chartered Institute of Purchasing and Supply/NTC survey. The headline UK September manufacturing index posted a level of 55.1, down from the now weaker 56.1 level registered in August. The reading still marks small gains on the three-month, six-month and year-over-year horizons for comparison (see table). Output prices rose to 57.8 in September from 56.0 in August, hitting their highest level since records began in 1999. The Bank of England has identified inflation as an upside inflation risk in the economy. This latest CIPS/NTC survey suggests that manufacturers are managing to push through price hikes. Nonetheless input prices eased to 62.3 from 63.8 in August, their lowest level since February. The pressure off input prices suggests that output price pressure should abate in the months ahead, possibly assuaging any concerns the BOE might have about the output price pressures. The decline in the headline activity index reflected a fall in the new orders index to 55.5 in September from 56.8 in August. Orders are now at their lowest level since January. Current output also fell to 58.2 from 60.5 in August. Moreover export orders plunged to 52.9 in September from 56.1 in the previous month. Other EU countries have been showing erratic readings for export strength. This slowing is part of a broader European pattern.
| MFG PMI CIPS/NTC | ||||||||
|---|---|---|---|---|---|---|---|---|
| Monthly readings | Change over: | percentile | ||||||
| Sep-07 | Aug-07 | Jul-07 | 3MO | 6MO | 12MO | of range | ||
| MFG | 55.08 | 56.15 | 55.71 | 0.38 | 0.68 | 0.55 | 69.4 | |
| Range since January 1992 | ||||||||
by Robert Brusca October 1, 2007
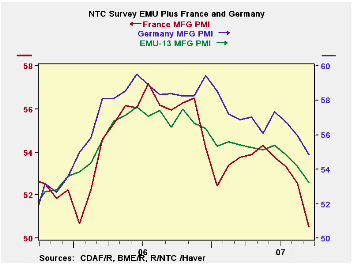
The finalized Euro area MFG PMIs from NTC show a picture of a weakening MFG sector. All countries for which up-to-date MFG readings are available show MFG is still expanding in September on a country by country basis in EMU (i.e. readings on the NTC index are still above 50). Yet the red monthly figures show period-to-period declines are now common and have been so for the region as a whole. All the large EMU economies (Germany, France, Italy and Spain) show month-to-month declines in MFG PMI for three straight months with the exception of Italy’s m/m rise in August. If we view these reading as a time series and ask which of the MFG sectors is at reading that is low compared to its own history only France is below the mid-range mark. Its 50.51 reading in September is below the midpoint of the range for France since March of 2000. For EMU as a whole the MFG index is in about the 60th percentile of its range for this period.
On balance, the EMU region is showing a loss in momentum. The EC Commission is complaining about the ill effects of a euro that is too strong. Manufacturing is fading in the Euro area although the current readings are still relatively firm and show ongoing expansion. But these readings are no longer strong and the momentum clearly points lower.
| NTC MFG Indexes | ||||||
|---|---|---|---|---|---|---|
| Sep-07 | Aug-07 | 3Mo | 6Mo | 12Mo | Percentile | |
| Euro-13 | 53.21 | 54.34 | 54.15 | 54.73 | 55.42 | 61.4% |
| Germany | 54.87 | 55.96 | 55.86 | 56.33 | 57.22 | 73.5% |
| France | 50.51 | 52.55 | 52.13 | 53.06 | 53.75 | 37.2% |
| Italy | 52.39 | 53.63 | 53.12 | 53.71 | 54.15 | 61.1% |
| Spain | 50.80 | 52.16 | 52.06 | 53.42 | 54.89 | 53.6% |
| Austria | 55.37 | 54.48 | 54.55 | 54.02 | 55.68 | 77.6% |
| Greece | 53.83 | 53.56 | 53.78 | 53.68 | 52.97 | 63.8% |
| Ireland | 54.35 | 54.32 | 53.92 | 53.50 | 53.02 | 86.3% |
| Netherlands | 56.36 | 56.19 | 56.91 | 57.01 | 56.77 | 79.8% |
| EU | ||||||
| UK | 55.08 | 56.15 | 55.65 | 55.08 | 54.32 | 89.0% |
by Louise Curley October 1, 2007
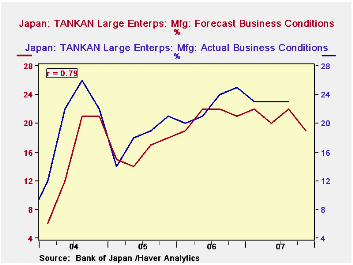
Results of the third quarter Tankan, the Bank of Japan's short term survey of business conditions of some 10,000 firms, released today, reveal, on balance, a subdued appraisal of business conditions and the immediate outlook. On the plus side, the excess of optimists over pessimists among large manufacturing corporations (the headline series) was 23%,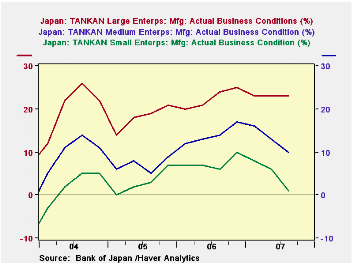 the same result as in the June and March Surveys. This was slightly better than these firms had forecast in June and was better than recent consensus estimates. However, there are now fewer large manufacturers who are positive on the outlook for the next quarter. The excess of optimists over pessimists is 19% for the fourth quarter. The actual results of the survey and the forecasts made one quarter earlier are shown in the first chart.
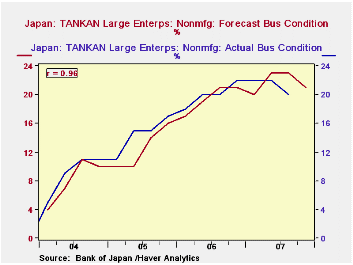
Among the more cautious indications, are a decline in the excess of optimists in the non manufacturing sector from 22% in the last three surveys to 20% in the current survey. This was 2 percentage points below the June forecast. The actual results and forecasts for the non manufacturing sector are shown in the second chart. (To the extent that the correlation is a good measure of goodness of fit, the forecasts in the non manufacturing sector appear to be more reliable than those in the manufacturing sector.)
Unfavorable trends were also apparent 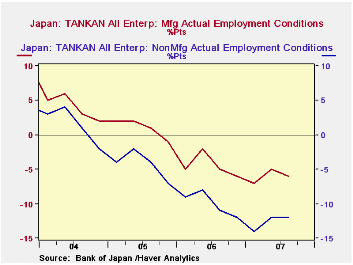 among the mid sized and small manufacturing firms. So far this year, excesses of optimists over pessimists in these firms have declined steadily. In September, the excess of mid-sized firms was 10%, down from 17% in the fourth quarter of 2006; the comparable figures for small firms were 1% from 10%. These data are shown in the third chart.
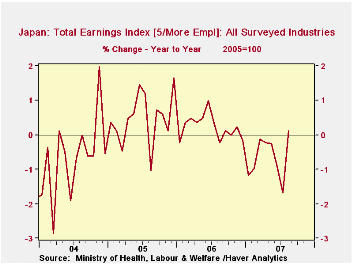
The September Tankan revealed some lessening of tightness in the labor market. However, a preponderance of firms are still reporting an excess of insufficient labor supply as can be seen in the fourth chart. In spite of tight labor conditions, nominal wages have been declining on a year over year basis. It was only in August that for the first time this year, nominal wages for all surveyed establishments of five or more employees were higher than those of a year ago, albeit, a mere 0.1%, as can be seen in the fifth chart.
| JAPAN TANKAN RESULTS | Q4 07 | Q3 07 | Q2 07 | Q1 07 | Q4 06 | Q3 06 | Q2 06 | Q1 06 |
|---|---|---|---|---|---|---|---|---|
| Large Corporations Manufacturing Headline Series Actual |
-- | 23 | 23 | 23 | 25 | 24 | 21 | 20 |
| Forecast | 19 | 22 | 20 | 22 | 21 | 22 | 22 | 19 |
| Large Corporations Non Manufacturing Actual |
-- | 20 | 22 | 22 | 22 | 20 | 20 | 18 |
| Forecast | 19 | 22 | 20 | 22 | 21 | 22 | 22 | 19 |
| Medium Sized Manufactures | -- | 10 | 13 | 16 | 17 | 14 | 13 | 12 |
| Small Sized Manufactures | -- | 1 | 6 | 8 | 10 | 6 | 7 | 7 |

Tom Moeller
AuthorMore in Author Profile »Prior to joining Haver Analytics in 2000, Mr. Moeller worked as the Economist at Chancellor Capital Management from 1985 to 1999. There, he developed comprehensive economic forecasts and interpreted economic data for equity and fixed income portfolio managers. Also at Chancellor, Mr. Moeller worked as an equity analyst and was responsible for researching and rating companies in the economically sensitive automobile and housing industries for investment in Chancellor’s equity portfolio. Prior to joining Chancellor, Mr. Moeller was an Economist at Citibank from 1979 to 1984. He also analyzed pricing behavior in the metals industry for the Council on Wage and Price Stability in Washington, D.C. In 1999, Mr. Moeller received the award for most accurate forecast from the Forecasters' Club of New York. From 1990 to 1992 he was President of the New York Association for Business Economists. Mr. Moeller earned an M.B.A. in Finance from Fordham University, where he graduated in 1987. He holds a Bachelor of Arts in Economics from George Washington University.
More Economy in Brief


