 Global| Aug 01 2006
ISM Index Recovered in July
by:Tom Moeller
|in:Economy in Brief
Summary
In July, the Composite Index of factory sector activity more than recovered the prior month's decline and rose to 54.7, reported the Institute for Supply Management. Consensus expectations had been for a slight decline to 53.5. During [...]
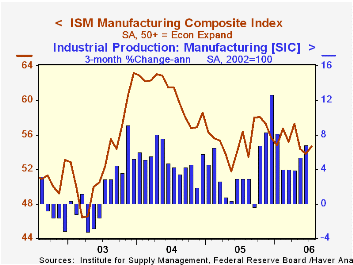
In July, the Composite Index of factory sector activity more than recovered the prior month's decline and rose to 54.7, reported the Institute for Supply Management. Consensus expectations had been for a slight decline to 53.5.
During the last twenty years there has been a 68% correlation between the level of the Composite Index and the three month growth in factory sector industrial production.
The production index rose to 57.5, the highest level since April but new orders gave back half of a June increase. New export orders fell to the lowest level (51.9) since June of last year.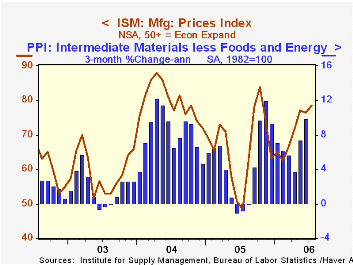
The employment index recovered half of the prior month's decline and rose to 50.7. During the last twenty years there has been a 66% correlation between the level of the ISM employment Index and the three month growth in factory sector employment.
The price index surged to the highest level (78.5) since last October. During the last twenty years there has been a 91% correlation between the price index and the three month change in the PPI for intermediate goods less food & energy.
| ISM Manufacturing Survey | July | Jun | July '05 | 2005 | 2004 | 2003 |
|---|---|---|---|---|---|---|
| Composite Index | 54.7 | 53.8 | 56.4 | 55.5 | 60.5 | 53.3 |
by Tom Moeller August 1, 2006
Personal income rose an expected 0.6% during June following an unrevised 0.4% increase in May. Earlier data reflected benchmark revision.
Wage & salary disbursements jumped 0.6% (6.9% y/y) in June following an unrevised no change the prior month. Strength was led by a 0.7% (7.9% y/y increase in private service-producing industry wages. Factory sector wages rose 0.3% (5.1% y/y) after an upwardly revised no change during May while earlier figures generally were revised up.
Higher interest rates boosted interest income by 1.7% (10.1% y/y) and dividend income jumped 1.0% (11.2% y/y).
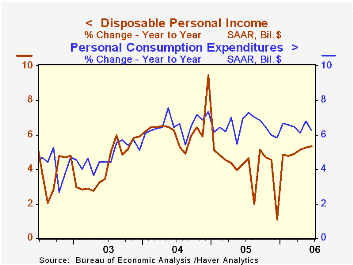
Disposable personal income increased 0.6% (5.3% y/y) after a 0.4% rise in May. Personal taxes rose 1.0% (15.4% y/y).
Adjusted for price inflation, disposable personal income rose 0.4% (1.7% y/y) after an unrevised slight decline in May. Real disposable income per capita rose 0.3% (0.8% y/y).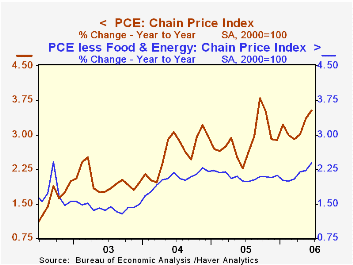
Personal consumption again matched Consensus expectations for a 0.4% rise after an upwardly revised 0.6% May rise. Adjusted for price inflation spending rose 0.2% (2.6% y/y) for the third straight month.
The PCE chain price index rose an expected 0.2%. Less food & energy prices rose 0.2% (2.4% y/y). The expected increase was the fifth in the last six months.
The personal savings rate was again negative. Should the Decline in the Personal Saving Rate Be a Cause for Concern? from the Federal Reserve Bank of Kansas City is available here.
The Anxious Index, a measure of the probability of a recession in the U.S. economy, from the Federal Reserve Bank of Philadelphia is available here.
| Disposition of Personal Income | June | May | Y/Y | 2005 | 2004 | 2003 |
|---|---|---|---|---|---|---|
| Personal Income | 0.6% | 0.4% | 6.5% | 5.2% | 6.2% | 3.2% |
| Personal Consumption | 0.4% | 0.6% | 6.2% | 6.5% | 6.6% | 4.8% |
| Savings Rate | -1.5% | -1.6% | -0.5% (June '05) | -0.4% | 2.0% | 2.1% |
| PCE Chain Price Index | 0.2% | 0.4% | 3.5% | 2.9% | 2.6% | 2.0% |
| Less food & energy | 0.2% | 0.2% | 2.4% | 2.1% | 2.0% | 1.4% |
by Tom Moeller August 1, 2006
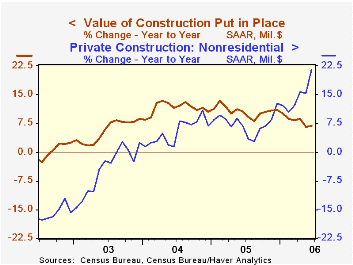
The value of construction put in place rose 0.3% in June following a slight May decline that was upwardly revised. Consensus expectations had been for a 0.1% increase.
Another strong gain in nonresidential building, up 2.7%, bolstered the June total. Office construction jumped 1.9% (12.6% y/y) while multi-retail building surged another 3.1% (52.5% y/y) and a 10.5% spike during May was double the initial estimate. Building by the factory sector surged 8.1% (34.7% y/y).
Residential building activity fell for the third straight month. The 1.0% decline was led by 2.1% drop in new single family building (-1.2% y/y). That's the first y/y decline since late 2000. Spending on multi-family projects ticked up 0.1% (14.7% y/y) while the value of spending on improvements jumped 1.6% (-1.6% y/y) but the prior month's surge was revised away.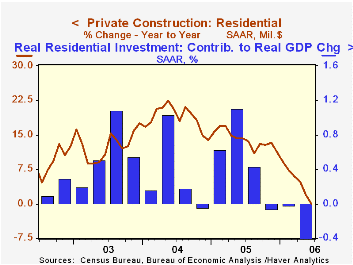
During the last twenty years there has been an 84% correlation between the q/q change in the value of residential building and its contribution to growth in real GDP. During April and May the value of residential building activity was down 1.3% from the 1Q average.
Public construction spending increased 0.8%. Construction activity on highways & streets, nearly one third of the value of public construction spending, rose just 0.1% (19.7% y/y) but the prior month's 0.1% gain reported initially was revised to a 4.3% surge.
These more detailed categories represent the Census Bureau’s reclassification of construction activity into end-use groups. Finer detail is available for many of the categories; for instance, commercial construction is shown for Automotive sales and parking facilities, drugstores, building supply stores, and both commercial warehouses and mini-storage facilities. Note that start dates vary for some seasonally adjusted line items in 2000 and 2002 and that constant-dollar data are no longer computed.
| Construction Put-in-place | June | May | Y/Y | 2005 | 2004 | 2003 |
|---|---|---|---|---|---|---|
| Total | 0.3% | -0.0% | 6.8% | 10.7% | 11.5% | 5.6% |
| Private | 0.1% | -0.5% | 6.0% | 12.0% | 14.3% | 6.4% |
| Residential | -1.0% | -1.4% | -0.1% | 13.9% | 18.6% | 12.8% |
| Nonresidential | 2.7% | 1.6% | 21.6% | 7.4% | 5.3% | -4.8% |
| Public | 0.8% | 1.6% | 9.7% | 6.2% | 2.8% | 2.9% |
by Tom Moeller August 1, 2006
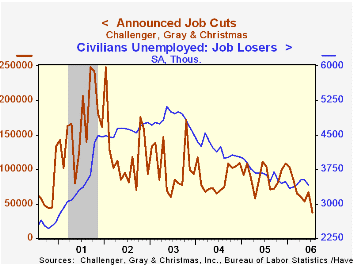
Challenger, Grey & Christmas reported that announced job cuts in July more than reversed the prior month's gain and dropped 44.7% to 37,178, the lowest level since June of 2000.
During the last ten years there has been an 83% (inverse) correlation between the three month moving average level of announced job cuts and the three month change payroll employment.
Layoffs fell sharply m/m in the automotive (-57.2% y/y), computer (-85.5% y/y), financial (-85.1% y/y), health care (65.8% y/y), industrial goods (-35.8% y/y) and pharmaceutical (-86.0% y/y) industries.
Job cut announcements differ from layoffs. Many are achieved through attrition, early retirement or just never occur.
A m/m increase in the level of layoffs was reported in the electronics (-91.5% y/y), chemical (-66.1% y/y) and the entertainment & leisure (+24.4% y/y) industries.
Challenger also reported that announced hiring plans more than doubled m/m (27.1% y/y).
| Challenger, Gray & Christmas | July | June | Y/Y | 2005 | 2004 | 2003 |
|---|---|---|---|---|---|---|
| Announced Job Cuts | 37,178 | 67,176 | -63.9% | 1,072,054 | 1,039,935 | 1,236,426 |
by Tom Moeller August 1, 2006
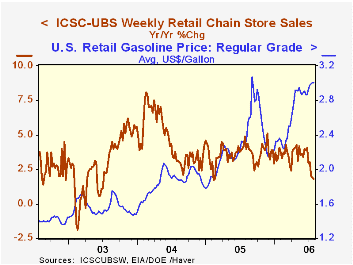
Weekly chain store sales rose another 0.9% last week after a 0.2% increase the prior period, according to the International Council of Shopping Centers (ICSC)-UBS survey.
The moderate increases continued to leave sales below earlier levels. As a result sales this month are running 0.6% below the June average. Both the June & May average sales levels fell 0.4% from the prior month. During the last ten years there has been a 47% correlation between the y/y change in chain store sales and the change in nonauto retail sales less gasoline.The ICSC-UBS retail chain-store sales index is constructed using the same-store sales (stores open for one year) reported by 78 stores of seven retailers: Dayton Hudson, Federated, Kmart, May, J.C. Penney, Sears and Wal-Mart.
The leading indicator of chain store sales from ICSC-UBS fell another 0.1% (-1.4% y/y) in the latest week.Retail gasoline prices during the last week of July ticked up slightly and the average retail price for regular unleaded gas settled at $3.00 per gallon (31.1% y/y) and prices in July averaged $2.98.
| ICSC-UBS (SA, 1977=100) | 07/29/06 | 07/22/06 | Y/Y | 2005 | 2004 | 2003 |
|---|---|---|---|---|---|---|
| Total Weekly Chain Store Sales | 471.2 | 467.1 | 1.8% | 3.6% | 4.7% | 2.9% |
by Louise Curley August 1, 2006
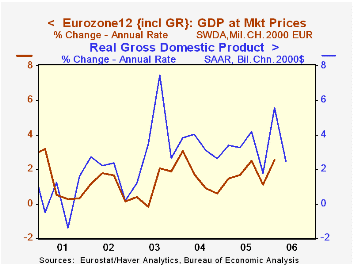
Incoming data on economic conditions in the Euro Zone suggests that the second quarter growth is likely to exceed the 2.53% annual rate of GDP growth in the first quarter. If so, it will be the first time since 2001 when the annual rate of growth in the Euro Zone exceeded that of the United States. The seasonally adjusted annual rates of GDP growth for the Euro Zone and the U. S are shown in the first chart.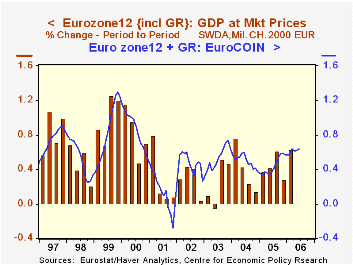
The unemployment rate for the Euro Zone fell to 7.8% in June, the lowest value since August, 2001. The average for the second quarter was 7.9% compared with 8.1 % in the first quarter. Most of the other current economic indicators, such as production, new orders, shipments and sales, have been positive, but are available only through May. However, the Center for Economic Policy Research (CEPR) based in London produces an indicator, EuroCOINTM, of the monthly growth in real GDP that is used in their analysis of the business cycle. This indicator tracks the quarterly changes in real GDP reasonably well as can be seen in the second chart.According to CEPR, if the value of the indicator is above the long term average of the monthly growth rate--0.59% (the monthly average growth of the sample period, 1988-2003)--this suggests that the economy is growing at a rate faster than the long term norm. In June, the indicator was .633 and for the second quarter it averaged .620 suggesting that second quarter growth is above average.
| Euro Zone | Jun 06 | May 06 | Jun 05 | M/M | Y/Y | 2005 | 2004 | 2003 |
|---|---|---|---|---|---|---|---|---|
| Unemployment Rate % | 7.8 | 7.9 | 8.6 | -0.1 | -0.8 | 8.6 | 8.9 | 8.7 |
| EuroCOIN | .633 | .617 | .365 | .016 | .268 | .442 | .497 | .527 |

Tom Moeller
AuthorMore in Author Profile »Prior to joining Haver Analytics in 2000, Mr. Moeller worked as the Economist at Chancellor Capital Management from 1985 to 1999. There, he developed comprehensive economic forecasts and interpreted economic data for equity and fixed income portfolio managers. Also at Chancellor, Mr. Moeller worked as an equity analyst and was responsible for researching and rating companies in the economically sensitive automobile and housing industries for investment in Chancellor’s equity portfolio. Prior to joining Chancellor, Mr. Moeller was an Economist at Citibank from 1979 to 1984. He also analyzed pricing behavior in the metals industry for the Council on Wage and Price Stability in Washington, D.C. In 1999, Mr. Moeller received the award for most accurate forecast from the Forecasters' Club of New York. From 1990 to 1992 he was President of the New York Association for Business Economists. Mr. Moeller earned an M.B.A. in Finance from Fordham University, where he graduated in 1987. He holds a Bachelor of Arts in Economics from George Washington University.
More Economy in Brief


