 Global| Oct 01 2002
ISM Index Fell Below 50
by:Tom Moeller
|in:Economy in Brief
Summary
The ISM Composite Index of manufacturing sector activity in September fell below 50 for the first time since January. The decline to 49.5 mirrored yesterday's report from the Chicago purchasing managers. Before that report, Consensus [...]
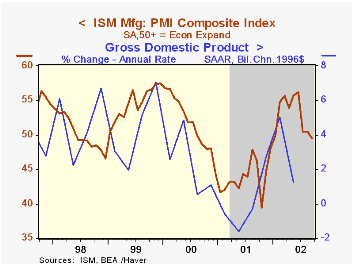
The ISM Composite Index of manufacturing sector activity in September fell below 50 for the first time since January. The decline to 49.5 mirrored yesterday's report from the Chicago purchasing managers. Before that report, Consensus expectations were for a modest rise in the ISM to 51.0.
Production and employment fell sharply while inventories fell just slightly. The indexes of vendor deliveries and new orders rose slightly.
Inflation pressure rose slightly following a sharp decline in August. The percentage (NSA) of companies reporting higher prices fell for the second month from the peak in July.
Over the last twenty years there has been a 76% correlation between the ISM Composite Index and the three month change in industrial production.
| ISM Manufacturing Survey | Sept | Aug | Y/Y | 2001 | 2000 | 1999 |
|---|---|---|---|---|---|---|
| Composite Index | 49.5 | 50.5 | 46.2 | 43.9 | 51.6 | 54.6 |
| Prices Paid Index | 62.5 | 61.5 | 36.6 | 43.0 | 64.8 | 54.2 |
by Tom Moeller October 1, 2002
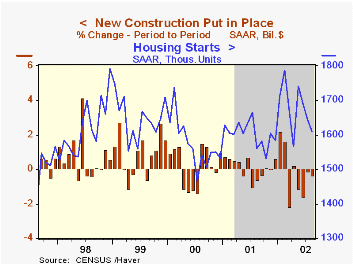
The value of construction put in place fell modestly, as expected in August. It was the fifth monthly decline in construction spending in the last six months and pulled YTD spending down 1.4%.
Residential building fell for the fourth month in five, but it was still up YTD as a result of large gains early in the year. Single family fell 0.7% (3.2% YTD) following a slight gain in July.
Nonresidential building activity fell hard for the sixth month this year and was down 13.7% YTD. The decline was again paced by lower industrial and office building.
Spending by governments rose slightly due to broad based increases amongst categories.
| Construction Put-in-place | Aug | July | Y/Y | 2001 | 2000 | 1999 |
|---|---|---|---|---|---|---|
| Total | -0.3% | -0.1% | -1.0% | 2.5% | 7.3% | 8.7% |
| Residential | -0.2% | -0.6% | 4.0% | 3.3% | 7.4% | 11.2% |
| Nonresidential | -2.0% | -2.6% | -18.5% | -3.1% | 7.1% | 1.9% |
| Public | 0.8% | 1.0% | 7.8% | 7.4% | 5.4% | 10.6% |
by Tom Moeller October 1, 2002
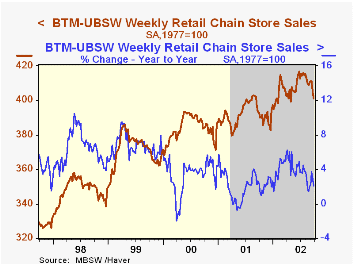
Chain store sales fell sharply for the second consecutive week according to the BTM-UBSW survey. Sales fell 0.8% last week and that followed a 1.7% drop the prior week.
Sales during September, with just two days yet to be tallied, fell 1.1% versus August. August sales were down 0.9% from July.
During the last five years there has been a 61% correlation between the year-to-year percent change in monthly chain store sales and the change in GAF retail sales. There has been a 17% correlation between the month-to-month change in the two sales series.
| BTM-UBSW (SA, 1977=100) | 9/28/02 | 9/21/02 | Y/Y | 2001 | 2000 | 1999 |
|---|---|---|---|---|---|---|
| Total Weekly Retail Chain Store Sales | 401.0 | 404.2 | 2.0% | 2.1% | 3.4% | 6.7% |

Tom Moeller
AuthorMore in Author Profile »Prior to joining Haver Analytics in 2000, Mr. Moeller worked as the Economist at Chancellor Capital Management from 1985 to 1999. There, he developed comprehensive economic forecasts and interpreted economic data for equity and fixed income portfolio managers. Also at Chancellor, Mr. Moeller worked as an equity analyst and was responsible for researching and rating companies in the economically sensitive automobile and housing industries for investment in Chancellor’s equity portfolio. Prior to joining Chancellor, Mr. Moeller was an Economist at Citibank from 1979 to 1984. He also analyzed pricing behavior in the metals industry for the Council on Wage and Price Stability in Washington, D.C. In 1999, Mr. Moeller received the award for most accurate forecast from the Forecasters' Club of New York. From 1990 to 1992 he was President of the New York Association for Business Economists. Mr. Moeller earned an M.B.A. in Finance from Fordham University, where he graduated in 1987. He holds a Bachelor of Arts in Economics from George Washington University.
More Economy in Brief


