 Global| Jul 03 2006
ISM Index Disappointing Again in June, but Orders Up
by:Tom Moeller
|in:Economy in Brief
Summary
The June Composite Index of factory sector activity reported by the Institute of Supply Management (ISM) slipped to 53.8 from 54.4 the month prior. Consensus expectations had been for a slight increase to 55.0. During the last twenty [...]
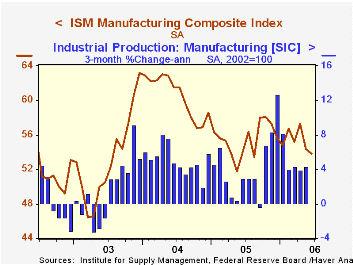
The June Composite Index of factory sector activity reported by the Institute of Supply Management (ISM) slipped to 53.8 from 54.4 the month prior. Consensus expectations had been for a slight increase to 55.0.
During the last twenty years there has been a 68% correlation between the level of the Composite Index and the three month growth in factory sector industrial production.
A 4.2 point drop in the employment index to 48.7 dropped the reading below the break even level of 50 for the first time in over a year. During the last twenty years there has been a 66% correlation between the level of the ISM employment Index and the three month growth in factory sector employment.
The production index also fell for the second consecutive month to its lowest (55.1) since early 2003 and the inventory index (46.9) fell for the fourth month this year.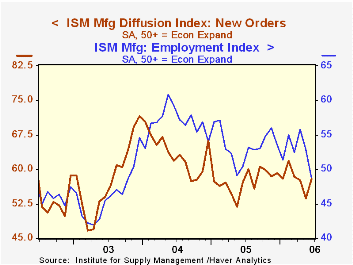
New orders (57.9) improved for the first month in the last four and recovered most of the prior two months' decline. New export orders slipped modestly m/m and at 55.4 were down from the highs of the prior nine months. During the last nineteen years there has been a 68% correlation between the level of the ISM export index and the y/y change in real exports of goods.
An index of order backlogs rose moderately to 54.0 following two months of sharp decline while the import index was unchanged at a still strong 56.5.
The price index slipped modestly following several m/m jumps earlier this year. During the last twenty years there has been a 91% correlation between the price index and the three month change in the PPI for intermediate goods less food & energy.
The Puzzling Convergence in Foreign Exchange Volatility from the Federal Reserve Bank of St. Louis is available here.
| ISM Manufacturing Survey | June | May | June '05 | 2005 | 2004 | 2003 |
|---|---|---|---|---|---|---|
| Composite Index | 53.8 | 54.4 | 54.0 | 55.5 | 60.5 | 53.3 |
| New Orders Index | 57.9 | 53.7 | 57.2 | 57.4 | 63.5 | 57.9 |
| Prices Paid Index (NSA) | 76.5 | 77.0 | 50.5 | 66.4 | 79.8 | 59.6 |
by Tom Moeller July 3, 2006
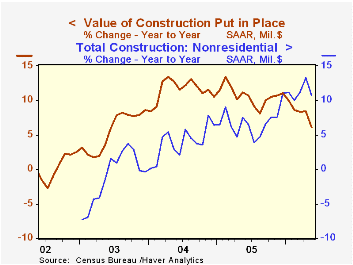
The value of construction put in place fell another 0.4% in May following a little revised 0.2% slip during April. Consensus expectations had been for a 0.2% gain and revisions to the data extended back to January 2003.
Lower residential building activity led the decline during May with a 0.8% drop. New single family building fell a notable 1.7% (+3.7% y/y) after a similar drop the month prior. Spending on multi-family projects slipped a more moderate 0.5% (+23.1% y/y) while the value of spending on improvements jumped 1.8% (-6.8% y/y).
During the last twenty years there has been an 84% correlation between the q/q change in the value of residential building and its contribution to growth in real GDP. During April and May the value of residential building activity was down 1.3% from the 1Q average.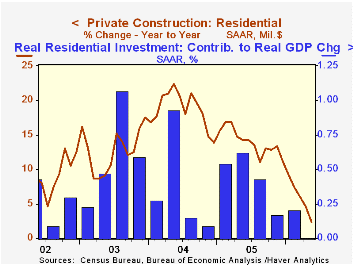
Nonresidential building slipped 0.3% following downwardly revised during prior months but the 2Q level so far is up 3.1% from the prior quarter. Office construction added 0.2% to the 2.5% surge during April (8.8% y/y) and commercial building slipped 0.8% (+5.4% y/y). Multi-retail building jumped another 5.1% (36.9% y/y) as building activity at shopping malls (39.3% y/y) and shopping centers (57.7% y/y) was firm.
Public construction spending increased 0.7% though construction activity on highways & streets, nearly one third of the value of public construction spending, rose just 0.1% (16.3% y/y) after several months of strong gain.
These more detailed categories represent the Census Bureau’s reclassification of construction activity into end-use groups. Finer detail is available for many of the categories; for instance, commercial construction is shown for Automotive sales and parking facilities, drugstores, building supply stores, and both commercial warehouses and mini-storage facilities. Note that start dates vary for some seasonally adjusted line items in 2000 and 2002 and that constant-dollar data are no longer computed.
| Construction Put-in-place | May | April | Y/Y | 2005 | 2004 | 2003 |
|---|---|---|---|---|---|---|
| Total | -0.4% | -0.2% | 6.0% | 10.7% | 11.5% | 5.6% |
| Private | -0.6% | -0.3% | 5.3% | 12.0% | 14.3% | 6.4% |
| Residential | -0.8% | -1.2% | 2.4% | 13.9% | 18.6% | 12.8% |
| Nonresidential | -0.3% | 1.6% | 12.7% | 7.4% | 5.3% | -4.8% |
| Public | 0.7% | 0.5% | 8.7% | 6.2% | 2.8% | 2.9% |
by Carol Stone July 3, 2006
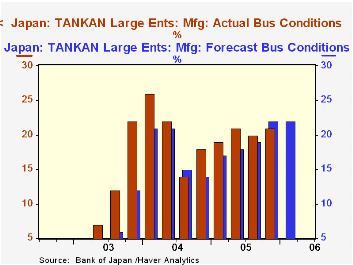
We've haven't commented on the Bank of Japan's TANKAN report since December, so even though we just talked about Japan's employment data on Friday, this information bears examination promptly as well. Large manufacturing firms, the widely followed "headline" segment, saw business conditions in June at +21%, up 1 point from March's 20% reading (a %-balance measure: % favorable less % unfavorable). This result was just below the group's forecast of 22%. They anticipate another 21% in September.
All size firms in all industries also firmed by 1 point from March, from +5% to +6% in June. This performance met their expectations and they look to repeat the +6% in September. All large firms have been holding at 20% with a prospect for 21% in September. Medium-sized companies moved up from +7% in March to +8% in June and hope for +9% in the next period. Small firms continue to struggle, however, with a -2% reading in this survey, a little better than March's -3%, although they look to some deterioration over the summer to -4%.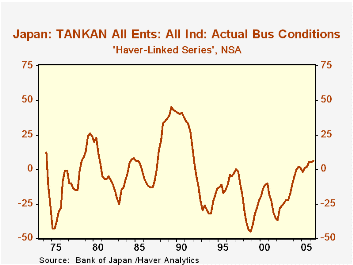
The large manufacturing companies report that their sales growth this fiscal year continues to come mainly from export customers, with a projection of a 5.2% gain; fiscal 2005 ended with a substantial 11.7% rise, 3.1% more than their last estimate. This year's estimate represents a 6.0 point upward revision of the previous export sales forecast. Domestic sales are not doing as well. The FY2005 outcome was 5.1% growth, even with the previous estimate, but the expectation for this year is just 1.7%, a downward revision of 0.9-point from the last forecast. A breakout by customer is not shown for other firm sizes or industries, but they all expect further gains in total sales this fiscal year and have raised their forecasts after 2005 came in better than forecast.
News reports highlighted forecasts for capital investment this year. Last year's actual spending amounts were in fact somewhat lower than forecast, albeit at still good rates; for example, large manufacturing firms expanded capital spending by 13.9%, but this was 2.6% lower than expected. However, rather than revising down this year's forecasts after that modest shortfall, these firms raised their 2006 plans by 8.2 points to 16.4%. This high number prompted a number of analysts to assert that it would add to the evidence favoring an increase in the BoJ's target overnight call rate at its meeting next week (July 13 & 14). The employment data we reported on Friday and another positive CPI for May (+0.6% year/year) also add to that argument. The call rate, which has been virtually 0% since September 2001, edged upward to 0.02% (2 basis points) last Friday, end-June.
Finally, as we call to your attention frequently, the TANKAN survey was dramatically reorganized two years ago, most significantly changing the very definition of "size" from employee-based to capital-based. Thus, for example, firms counted as "small" before because they employed fewer than 300 people might now be "large" because they have substantial capital; this is particularly true for high-tech companies. Thus, we continue to separate data for the two periods in the survey in our JAPAN database. However, in the Haver database "G10", where we include some customized series that we calculate, we show a long history for "all firms", which would not have been affected by the modified size criterion. That series, seen in the second graph, was +6 this quarter, the highest reading since December 1991, 14-1/2 years ago.
| Business Conditions: % Favorable minus % Unfavorable | June 2006 March 2006 December 2005Sept 2005 | ||||||
|---|---|---|---|---|---|---|---|
| Forecast for Sept | Actual | Forecast for June | Actual | Forecast for Mar | Actual | Forecast for Dec | |
| All Firms | 6 | 6 | 6 | 5 | 4 | 5 | 2 |
| Large Firms* | 21 | 20 | 20 | 20 | 18 | 19 | 17 |
| Manufacturing ("Headline Series") | 22 | 21 | 22 | 20 | 19 | 21 | 18 |
| Nonmanufacturing | 21 | 20 | 19 | 18 | 17 | 17 | 16 |
| Medium-Sized Firms** | 9 | 8 | 8 | 7 | 5 | 5 | 3 |
| Small Firms*** | -4 | -2 | -2 | -3 | -4 | -2 | -5 |

Tom Moeller
AuthorMore in Author Profile »Prior to joining Haver Analytics in 2000, Mr. Moeller worked as the Economist at Chancellor Capital Management from 1985 to 1999. There, he developed comprehensive economic forecasts and interpreted economic data for equity and fixed income portfolio managers. Also at Chancellor, Mr. Moeller worked as an equity analyst and was responsible for researching and rating companies in the economically sensitive automobile and housing industries for investment in Chancellor’s equity portfolio. Prior to joining Chancellor, Mr. Moeller was an Economist at Citibank from 1979 to 1984. He also analyzed pricing behavior in the metals industry for the Council on Wage and Price Stability in Washington, D.C. In 1999, Mr. Moeller received the award for most accurate forecast from the Forecasters' Club of New York. From 1990 to 1992 he was President of the New York Association for Business Economists. Mr. Moeller earned an M.B.A. in Finance from Fordham University, where he graduated in 1987. He holds a Bachelor of Arts in Economics from George Washington University.
More Economy in Brief


