 Global| Nov 02 2009
ISM Factory Index Rises FurtherContinuing Respectable Rebound
by:Tom Moeller
|in:Economy in Brief
Summary
The recession in U.S. factory sector activity is over, according to the data from the National Association of Purchasing Management. Their composite index for October rose to 55.7 which was its highest level since April 2006. (Any [...]
The recession in U.S. factory sector activity is over, according to the data from the National Association of Purchasing Management. Their composite index for October rose to 55.7 which was its highest level since April 2006. (Any reading above the break-even point of 50 suggests rising activity.) The latest figure exceeded Consensus expectations for a little-changed reading of 53.0 and was up from the low of 32.9 reached last December. The ISM data is available in Haver's USECON database.
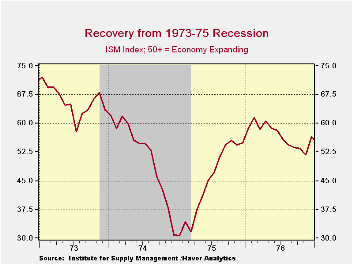
 While just above the break-even level of 50, the
factory-sector growth suggested by the ISM index is in line with
recoveries accompanying past upturns after severe recessions. To mirror
the strength of those recoveries, however, the index still needs to
rise to a level near or above the level of 60.
While just above the break-even level of 50, the
factory-sector growth suggested by the ISM index is in line with
recoveries accompanying past upturns after severe recessions. To mirror
the strength of those recoveries, however, the index still needs to
rise to a level near or above the level of 60.
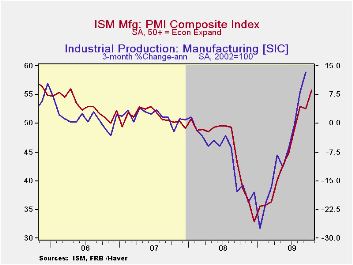
 A sharp increase in the production component to a 63.3 led the
latest increase. During the last ten years there has been an 84%
correlation between the level of the production component of the
composite index and the three-month growth in factory sector industrial
production. It is appropriate to correlate the ISM index level
with factory sector output growth because the ISM
index is a diffusion index. It measures growth by using all of the
positive changes in activity added to one half of the zero change in
activity measures. Also rising was the inventories index to
46.9 which was its highest level since June of last year. Compared to
the low of 32.2 reached earlier this year, the latest figure suggests
that the correction of factory-sector inventory levels is about over.
A sharp increase in the production component to a 63.3 led the
latest increase. During the last ten years there has been an 84%
correlation between the level of the production component of the
composite index and the three-month growth in factory sector industrial
production. It is appropriate to correlate the ISM index level
with factory sector output growth because the ISM
index is a diffusion index. It measures growth by using all of the
positive changes in activity added to one half of the zero change in
activity measures. Also rising was the inventories index to
46.9 which was its highest level since June of last year. Compared to
the low of 32.2 reached earlier this year, the latest figure suggests
that the correction of factory-sector inventory levels is about over.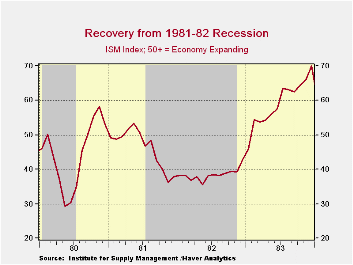
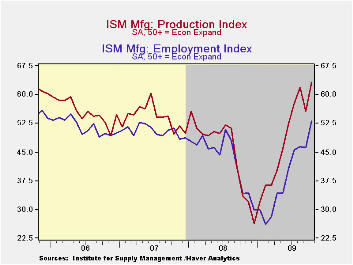
Also to the upside, the employment index improved to 53.1 and indicated growth in factory-sector payrolls for the first month since July of last year. During the last ten years there has been a 90% correlation between the index level and the three-month change in manufacturing payrolls.
 The new orders index slipped m/m to a still-strong reading of
58.5, though it was shy of its recent high. Also to the downside was
the speed of supplier deliveries index which slipped and erased the
gains of the prior two months. Suggesting moderation in the economic
downturns abroad, the export order index rose to 55.5 which was the
highest level since August of last year. During the last ten years
there has been a 53% correlation between the index and the q/q change
in real exports of goods in the GDP accounts.
The new orders index slipped m/m to a still-strong reading of
58.5, though it was shy of its recent high. Also to the downside was
the speed of supplier deliveries index which slipped and erased the
gains of the prior two months. Suggesting moderation in the economic
downturns abroad, the export order index rose to 55.5 which was the
highest level since August of last year. During the last ten years
there has been a 53% correlation between the index and the q/q change
in real exports of goods in the GDP accounts.
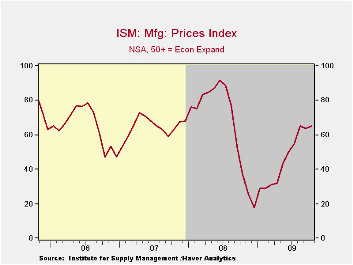
The separate index of prices paid continued to indicate improved factory sector activity with a rise to 65.0. That recovered the September decline and was up from the December low of 18.0. During the last twenty years there has been a 79% correlation between the price index and the three-month change in the PPI for intermediate goods.
The Yield Curve, October 2009 from the Federal Reserve Bank of Cleveland can be found here.
| ISM Mfg | October | September | August | October '08 | 2008 | 2007 | 2006 |
|---|---|---|---|---|---|---|---|
| Composite Index | 55.7 | 52.6 | 52.9 | 38.7 | 45.5 | 51.1 | 53.1 |
| New Orders Index | 58.5 | 60.8 | 64.9 | 32.4 | 42.1 | 54.3 | 55.4 |
| Employment Index | 53.1 | 46.2 | 46.4 | 34.2 | 43.2 | 50.5 | 51.7 |
| Prices Paid Index (NSA) | 65.0 | 63.5 | 65.0 | 37.0 | 66.5 | 64.6 | 65.0 |
Europe's MFG PMIs Continue To Rise. EMU PMI Rises Over 50 For First Time In 18 Months To Vee Or Not To Vee…Is That A Question?
by Robert Brusca November 02, 2009
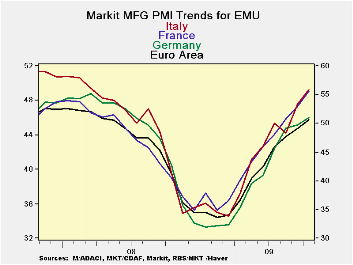
Europe’s MFG sector is up over the neutral reading of 50 for the first time in 17 months. The Markit/NTC gauges of the EMU economy and for individual nations is a stronger reading than in the EU Commission framework.
Five of the nine economies with individual readings in the table are above the breakeven value of ‘50’ in October. Among these nine nations only Greece saw its reading slip in October.
The rebound now looks like that much talked above Vee-shape. Despite rampant pessimism Europe is putting on a good recovery in Manufacturing. The EMU countries as well as the UK are looking quite strong.
The EMU percentile standings for these gauges are in the low 6oth percentile up to the 69th percentile for France and Austria; the 65th for Germany. This is evidence of a true recovery and is one of the more optimistic reports out of Europe for some time.
| NTC/Markit MFG Indices | |||||||
|---|---|---|---|---|---|---|---|
| Oct-09 | Sep-09 | Aug-09 | 3Mo | 6Mo | 12Mo | Percentile | |
| Euro-13 | 50.73 | 49.29 | 48.24 | 49.42 | 46.30 | 40.50 | 63.8% |
| Germany | 51.04 | 49.65 | 49.17 | 49.95 | 45.99 | 39.68 | 65.9% |
| France | 55.61 | 52.99 | 50.78 | 53.13 | 49.45 | 43.18 | 69.2% |
| Italy | 49.24 | 47.58 | 44.25 | 47.02 | 45.04 | 40.30 | 57.8% |
| Spain | 46.30 | 45.82 | 47.20 | 46.44 | 44.87 | 38.17 | 61.4% |
| Austria | 51.05 | 50.31 | 49.95 | 50.44 | 46.51 | 41.06 | 69.7% |
| Greece | 47.97 | 48.46 | 51.13 | 49.19 | 48.36 | 44.27 | 46.2% |
| Ireland | 48.01 | 46.57 | 44.01 | 46.20 | 44.01 | 40.20 | 63.9% |
| Netherlands | 50.52 | 50.02 | 50.51 | 50.35 | 47.22 | 42.24 | 61.7% |
| EU | |||||||
| UK | 53.68 | 49.85 | 50.47 | 51.33 | 49.57 | 43.58 | 87.8% |
| percentile is over range since March 2000 | |||||||
U.S. Pending Home Sales Rise To Highest Since 2006
by Tom Moeller November 2, 2009
 Housing
demand is increasing faster than generally expected. The National
Association of Realtors (NAR) reported that September pending home
sales increased 6.1%. The gain was similar to the August increase and
continued stronger than June's 3.6% and July's 3.2% gains. Consensus
expectations had been for a slight m/m sales decline. The index level
of 110.1 was at its highest since December 2006 and up 26.9% from the
January low. The base for the index is 2001=100.
Housing
demand is increasing faster than generally expected. The National
Association of Realtors (NAR) reported that September pending home
sales increased 6.1%. The gain was similar to the August increase and
continued stronger than June's 3.6% and July's 3.2% gains. Consensus
expectations had been for a slight m/m sales decline. The index level
of 110.1 was at its highest since December 2006 and up 26.9% from the
January low. The base for the index is 2001=100.
 September
sales likely were boosted by the pending expiration of an
$8,000 first-time home buyers tax credit; due to expire later this
month. Congress currently is considering extending the credit through
April of next year.
September
sales likely were boosted by the pending expiration of an
$8,000 first-time home buyers tax credit; due to expire later this
month. Congress currently is considering extending the credit through
April of next year.
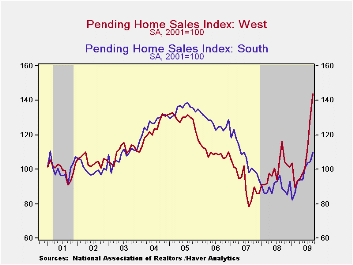
In this report only the Northeast region of the
country failed to participate in the September sales gain. Sales in the
West jumped 10.2% after a 16.0% rise during August. The sales index
here was at its all-time high. Elsewhere, sales in the Midwest gained
8.1% on top of a 3.1% rise in August. 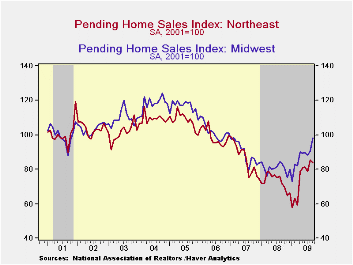 They were up more than one-third
from the January low. Sales in the South were the laggards with just a
4.9% gain but they also were up one-third from the January trough.
Sales in the Northeast slipped 2.0% during September, down for the
second month in the last three but still 44.6% higher than the January
low.
They were up more than one-third
from the January low. Sales in the South were the laggards with just a
4.9% gain but they also were up one-third from the January trough.
Sales in the Northeast slipped 2.0% during September, down for the
second month in the last three but still 44.6% higher than the January
low.
These home sales figures are analogous to the new home sales data from the Commerce Department in that they measure existing home sales when the sales contract is signed, not at the time the sale is closed. The series dates back to 2001.
The pending home sales data are available in Haver's PREALTOR database. The number of homes on the market and prices are in the REALTOR database.
| Pending Home Sales (2001=100) | September | August | July | Y/Y | 2008 | 2007 | 2006 |
|---|---|---|---|---|---|---|---|
| Total | 110.1 | 103.8 | 97.6 | 21.1% | 86.8 | 95.8 | 112.1 |
| Northeast | 83.6 | 85.3 | 78.8 | 16.9 | 73.1 | 85.9 | 98.9 |
| Midwest | 98.2 | 90.8 | 88.1 | 17.7 | 80.6 | 89.5 | 101.9 |
| South | 109.7 | 104.6 | 103.8 | 22.8 | 89.6 | 107.3 | 127.2 |
| West | 143.8 | 130.5 | 112.5 | 23.6 | 99.5 | 92.3 | 109.6 |
U.S. Home Prices On The Rise; Distressed Sales Matter
by Tom Moeller November 2, 2009
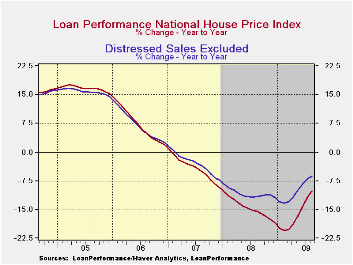 Without question, the sales price of most homes is under
pressure. Demand is down and supply is up. Nevertheless, home prices
recently have turned around after a decline that began early in 2006.
On a month-to-month basis home prices have risen for the last five
months, as measured by First American CoreLogic. Moreover, the y/y
decline is half that logged early this year. Nevertheless, prices still
are down 10.1% from August of 2008 and they have fallen 28.1% from the
peak during the spring of 2006.
Without question, the sales price of most homes is under
pressure. Demand is down and supply is up. Nevertheless, home prices
recently have turned around after a decline that began early in 2006.
On a month-to-month basis home prices have risen for the last five
months, as measured by First American CoreLogic. Moreover, the y/y
decline is half that logged early this year. Nevertheless, prices still
are down 10.1% from August of 2008 and they have fallen 28.1% from the
peak during the spring of 2006.
Until 2006, measuring the degree to which prices were affected by distressed sales hadn't been much of an issue. Recently, however, it has become relevant in providing perspective on home price performance. When distressed sales are stripped out prices also are down y/y, but the depth of the decline is less dramatic than the total. These prices have risen for just the last four months, but the y/y change of -6.3% is notably moderate. Since the peak these prices have fallen 20.8%.
The Loan Performance House Price Index (HPI) is a repeat-sales index that tracks increases and decreases in sales prices for the same homes over time. This approach provides a more accurate "constant-quality" view of pricing trends than basing analysis on all home sales. The data are developed by First American CoreLogic and are available from Haver's USECON database. Seasonal adjustment of the data is done by Haver Analytics.
Residential
and commercial real estate is the title of this morning's
testimony by Jon
D. Greenlee, Associate Director, Division of Banking Supervision and
Regulation
and it can be found here here.
| House Price (SA) | August | July | 2008 | 2007 | 2006 |
|---|---|---|---|---|---|
| Total (year-to-year) | -10.1 | -11.7 | -14.6 | -4.4 | -7.1 |
| month-to-month | 0.7 | 1.5 | |||
| Distress Sales Excluded (y/y) | -6.3 | -6.9 | -10.9 | -3.0 | -6.8 |
| month-to-month | 0.1 | 0.7 |
by Louise Curley November 2, 2009
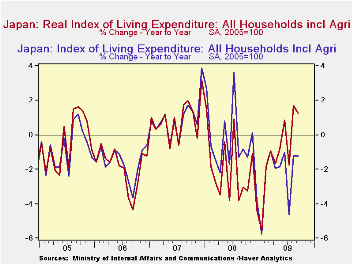 Japanese
household consumption expenditures in the third quarter will not be
known until the "First Preliminary Release" of GDP for the third
quarter due November 16 is released. Some indication of what
the consumers is doing can be gleaned from recent monthly data from the
Family Income and Expenditure Survey and the data on wages and
employment.
Japanese
household consumption expenditures in the third quarter will not be
known until the "First Preliminary Release" of GDP for the third
quarter due November 16 is released. Some indication of what
the consumers is doing can be gleaned from recent monthly data from the
Family Income and Expenditure Survey and the data on wages and
employment.
 Results of
Japan's Family Income and Expenditure Survey
for September were released over the week end. In nominal
terms, the index of living expenditures declined in July to 95.0 (2005
= 100) from 97.0 in June, but rose in August and September to 96.9 and
97.3, respectively. Nevertheless, for the quarter, living
expenditures in nominal terms were 2.4% below the year ago
figure. As a result of continued deflation in the Japanese
economy, real living expenditures increased in August and September and
for the quarter were up 0.4% from the third quarter of 2008 as can be
seen in the first chart.
On the whole, the Family Income and
Expenditure Surveys for the last three months suggest that real
consumer spending may show a small increase in the third quarter.
Results of
Japan's Family Income and Expenditure Survey
for September were released over the week end. In nominal
terms, the index of living expenditures declined in July to 95.0 (2005
= 100) from 97.0 in June, but rose in August and September to 96.9 and
97.3, respectively. Nevertheless, for the quarter, living
expenditures in nominal terms were 2.4% below the year ago
figure. As a result of continued deflation in the Japanese
economy, real living expenditures increased in August and September and
for the quarter were up 0.4% from the third quarter of 2008 as can be
seen in the first chart.
On the whole, the Family Income and
Expenditure Surveys for the last three months suggest that real
consumer spending may show a small increase in the third quarter.
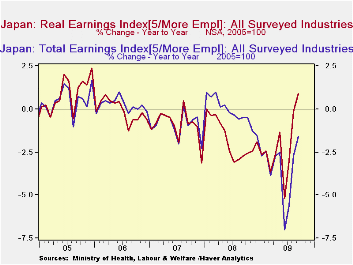
The
outlook for consumer incomes and hence their ability to spend is
mixed. Seasonally unadjusted wages in nominal terms have
continued to decline on a year to year basis--5.6% in July, 2.7% in
August and 1.59% in September.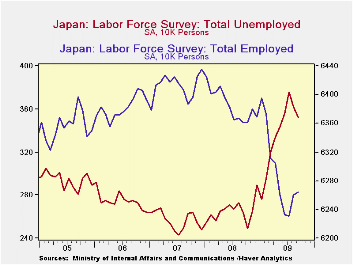 But again adjusted for
deflation, real wages were up 0.9% in September over September, 2008
one of the few year over year increases in real wages that has occurred
over the past three years as can be seem in the second Chart.
Employment increased and unemployment decreased
marginally in August and September as can be seen
in the third chart.
But again adjusted for
deflation, real wages were up 0.9% in September over September, 2008
one of the few year over year increases in real wages that has occurred
over the past three years as can be seem in the second Chart.
Employment increased and unemployment decreased
marginally in August and September as can be seen
in the third chart.
| Sep 09 | Aug 09 | Jul 09 | Jun 09 | May 09 | Apr 08 | Mar 09 | Feb 09 | Jan 09 | |
|---|---|---|---|---|---|---|---|---|---|
| Real Living Expenditures (Y/Y % Chg) | 1.25 | 1.68 | -1.75 | 0.84 | -0.82 | -1.16 | -0.93 | -18.4 | -5.54 |
| Nominal Living Expenditures (Y/Y % Chg) | -1.22 | -1.22 | -4.62 | -1.02 | -1.81 | -1.94 | -0.92 | -1.82 | -5.76 |
| Real Wages (Y/Y % Chg) | 0.88 | -0.12 | -3.02 | -5.2 | -1.35 | -2.64 | -3.66 | -2.44 | -2.63 |
| Nominal Wages (Y/Y % Chg) | -1.59 | -2.71 | -5.60 | -7.01 | -2.53 | -2.73 | -3.85 | -2.43 | -2.72 |
| Employment (10,000 Persons) | 6264 | 6260 | 6231 | 6233 | 6201 | 6305 | 6311 | 6373 | 6395 |
| Unemployment | 352 | 362 | 376 | 336 | 343 | 334 | 320 | 295 | 276 |

Tom Moeller
AuthorMore in Author Profile »Prior to joining Haver Analytics in 2000, Mr. Moeller worked as the Economist at Chancellor Capital Management from 1985 to 1999. There, he developed comprehensive economic forecasts and interpreted economic data for equity and fixed income portfolio managers. Also at Chancellor, Mr. Moeller worked as an equity analyst and was responsible for researching and rating companies in the economically sensitive automobile and housing industries for investment in Chancellor’s equity portfolio. Prior to joining Chancellor, Mr. Moeller was an Economist at Citibank from 1979 to 1984. He also analyzed pricing behavior in the metals industry for the Council on Wage and Price Stability in Washington, D.C. In 1999, Mr. Moeller received the award for most accurate forecast from the Forecasters' Club of New York. From 1990 to 1992 he was President of the New York Association for Business Economists. Mr. Moeller earned an M.B.A. in Finance from Fordham University, where he graduated in 1987. He holds a Bachelor of Arts in Economics from George Washington University.
More Economy in Brief


