 Global| Oct 02 2006
ISM Composite & Price Indexes Down
by:Tom Moeller
|in:Economy in Brief
Summary
The September composite index of manufacturing sector activity from the Institute for Supply Management fell to 52.9 from 54.5 during the prior month. The decline was the fourth in the last five months and left the index down five [...]
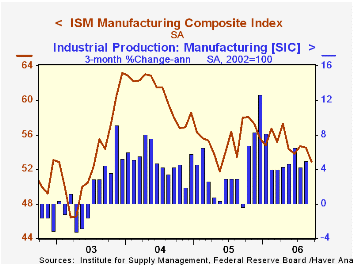
The September composite index of manufacturing sector activity from the Institute for Supply Management fell to 52.9 from 54.5 during the prior month. The decline was the fourth in the last five months and left the index down five points from the year ago peak of 58.1 Consensus expectations had been for a more moderate decline m/m to 53.5.
During the last ten years there has been a 67% correlation between the level of the ISM index and three month growth in factory sector industrial production.
At 61.0 the price index, which is not included in the composite, dropped to its lowest level since last November. During the last ten years there has been an 89% correlation between the level of the price index and the three month change in the PPI for intermediate goods less food & energy.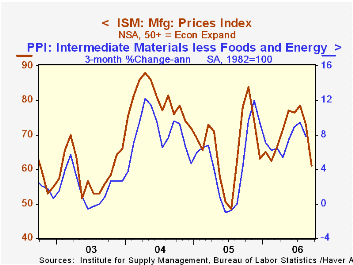
The percentage of respondents reporting higher prices fell to its lowest level (36%) since February.
A lower employment component, which fell to 49.4 from a four month high of 54.0 in August, accounted for much of the m/m decline in the composite. During the last ten years there has been a 77% correlation between the level of the ISM employment Index and the three month growth in factory sector employment.
The inventories index also fell sharply m/m while all of the other component series fell modestly with the exception of new orders which was unchanged m/m. The new orders index, however, at 54.2 is down sharply from the December 2003 high of 71.6.
The new export orders index fell modestly m/m to 55.3 and is down roughly three points from the recent high in January of 58.5. The series peak was in early 2004 near 60. During the last ten years there has been a 69% correlation between the level of the export order index and the q/q growth in goods exports from the GDP accounts. The imports index rose back to the middle of its range since early 2005.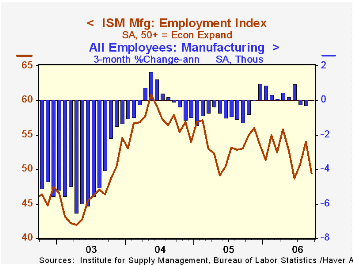
Explaining Cyclical Movements in Employment: Creative Destruction or Changes in Utilization from the Board of Governors of the Federal Reserve System is available here.
Economic Revitalization Through the Arts: The Creative Economy from the Federal Reserve Bank of Boston can be found here.
| ISM Manufacturing Survey | September | August | Sept. '05 | 2005 | 2004 | 2003 |
|---|---|---|---|---|---|---|
| Composite Index | 52.9 | 54.5 | 58.0 | 55.5 | 60.5 | 53.3 |
| Prices Index (NSA) | 61.0 | 73.0 | 78.0 | 66.4 | 79.8 | 59.6 |
by Tom Moeller October 2, 2006
The August value of construction put in place rose a modest 0.3% after a little revised 1.0% drop during July. Consensus expectations had been for a 0.4% decline. Despite the latest increase the level of 3Q activity remained 1.0% below 2Q.
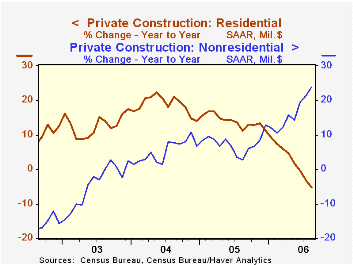
Residential building dropped another 1.4%, the fifth sharp slide in as many months. New single family building dropped 2.7% (-9.3% y/y) and the August level was down 12.5% from the peak in February. Moving in the other direction the value of spending on improvements rose 1.1%% (0.8% y/y).
During the last twenty years there has been an 84% correlation between the q/q change in the value of residential building and its contribution to growth in real GDP.
Nonresidential building jumped 3.4% after an upwardly revised 1.3% July rise. Office construction surged 3.1% (27.5% y/y) while multi-retail building jumped 10.8% (51.1% y/y). Building by the factory sector surged 8.2% (28.4% y/y) to the highest level since 2001.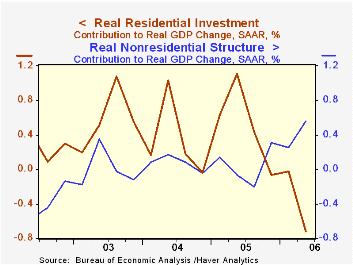
Public construction spending reversed all of the prior month's revised decline with a 1.1% increase due to across the board gains. Construction activity on highways & streets, nearly one third of the value of public construction spending, rose 0.4% (17.6% y/y).
These more detailed categories represent the Census Bureau’s reclassification of construction activity into end-use groups. Finer detail is available for many of the categories; for instance, commercial construction is shown for Automotive sales and parking facilities, drugstores, building supply stores, and both commercial warehouses and mini-storage facilities. Note that start dates vary for some seasonally adjusted line items in 2000 and 2002 and that constant-dollar data are no longer computed.
Are Investors More Risk-Averse During Recession? from the Federal Reserve Bank of St. Louis can be found here.
| Construction Put-in-place | August | July | Y/Y | 2005 | 2004 | 2003 |
|---|---|---|---|---|---|---|
| Total | 0.3% | -1.0% | 4.5% | 10.7% | 11.5% | 5.6% |
| Private | 0.1% | -1.0% | 2.9% | 12.0% | 14.3% | 6.4% |
| Residential | -1.4% | -2.2% | -5.1% | 13.9% | 18.6% | 12.8% |
| Nonresidential | 3.4% | 1.3% | 23.8% | 7.4% | 5.3% | -4.8% |
| Public | 1.1% | -1.2% | 9.7% | 6.2% | 2.8% | 2.9% |
by Louise Curley October 2, 2006
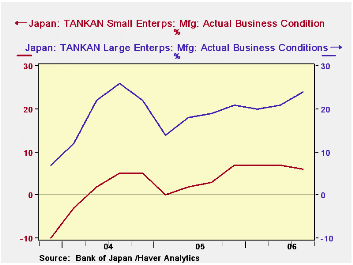
The Bank of Japan's Tankan Survey released this morning shows a greater than expected increase in the headline series (Diffusion index for large manufacturers' current conditions) from 21% in June to 24% in September and was 5 percentage points above June, 2005. A weakening of the yen and a fall in oil prices since the June survey has contributed to the increase in economic activity. Confidence in current conditions also improved for medium sized manufactures--from 13% to 14%--while that for small manufacturers declined--from 7% to 6%. The trends of the diffusion indexes of actual conditions in the large and small manufacturers are shown in the first chart.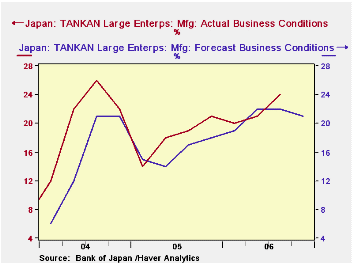
While Japanese manufacturers were more confident in their appraisal of current conditions, they were less confident in their appraisal of the future. The diffusion index for large manufacturers' appraisal of the future fell from 22% to 21%, that for medium manufacturers fell from 13% to 11% while that for small firms remained unchanged at 7%. The contrast between the optimistic appraisal of current conditions and less sanguine appraisal of the future for large corporations is shown in the second chart.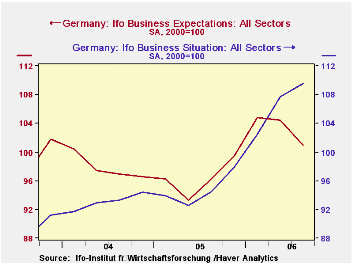
The IFO Survey of German business released last week showed the same general trends as the Tankan Survey--an improved appraisal of current conditions and less sanguine view of the outlook. We suggested, in that in case of Germany, that the decline in the appraisal of the future was more likely to reflect caution rather than alarm as current conditions had rec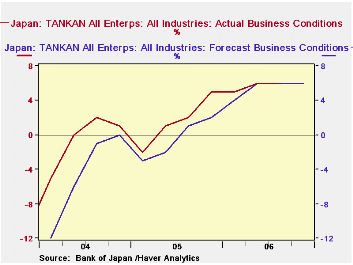 ently been much better than anticipated. (See Chart 3) In the case of Japan, actual business conditions for all industries have been better than expectations since the series began in 2004 until the second and third quarters of this year when they equaled expectations. (See Chart 4)
With the economy in the United States slowing, attention is being brought to bear on the prospects for growth in the next two largest industrial economies. While these surveys suggest some deceleration in growth may be in the cards for Japan and Germany, the trend of growth in both countries continues to recover from the depressed years of the recent past.
| Japan TANKAN (%) | 3Q 06 | 2Q 06 | 3Q 05 | Q/Q Dif | Y/Y Dif | 2006 | 2005 | 2004 |
|---|---|---|---|---|---|---|---|---|
| ACTUAL CONDITIONS | ||||||||
| Large Corporations | 24 | 21 | 19 | 3 | 5 | 18 | 21 | |
| Medium Corporations | 14 | 13 | 5 | 1 | 9 | 7 | 10 | |
| Small Corporations | 6 | 7 | 3 | -1 | 3 | 3 | 2 | |
| FORECASTS | 4Q 06 | 3Q 06 | 4Q 05 | Q/Q Dif | Y/Y Dif | 2006 | 2005 | 2004 |
| Large Corporations | 21 | 22 | 18 | -1 | 3 | 21 | 16 | 15 |
| Medium Corporations | 11 | 13 | 6 | -2 | 7 | 11 | 4 | 4 |
| Small Corporations | 7 | 7 | 1 | 0 | 6 | 7 | 1 | -2 |

Tom Moeller
AuthorMore in Author Profile »Prior to joining Haver Analytics in 2000, Mr. Moeller worked as the Economist at Chancellor Capital Management from 1985 to 1999. There, he developed comprehensive economic forecasts and interpreted economic data for equity and fixed income portfolio managers. Also at Chancellor, Mr. Moeller worked as an equity analyst and was responsible for researching and rating companies in the economically sensitive automobile and housing industries for investment in Chancellor’s equity portfolio. Prior to joining Chancellor, Mr. Moeller was an Economist at Citibank from 1979 to 1984. He also analyzed pricing behavior in the metals industry for the Council on Wage and Price Stability in Washington, D.C. In 1999, Mr. Moeller received the award for most accurate forecast from the Forecasters' Club of New York. From 1990 to 1992 he was President of the New York Association for Business Economists. Mr. Moeller earned an M.B.A. in Finance from Fordham University, where he graduated in 1987. He holds a Bachelor of Arts in Economics from George Washington University.
More Economy in Brief


