 Global| Jan 03 2007
ISM Composite Index Recovered A Bit
by:Tom Moeller
|in:Economy in Brief
Summary
The composite index of manufacturing activity from the Institute for Supply Management recovered in December to 51.4 from 49.5 the prior month. Consensus expectations had been for less of an improvement to 50.0. During the last ten [...]
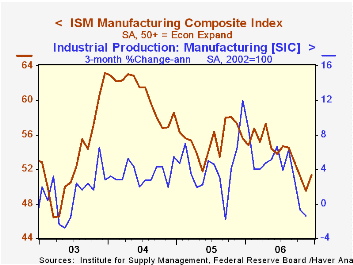
The composite index of manufacturing activity from the Institute for Supply Management recovered in December to 51.4 from 49.5 the prior month. Consensus expectations had been for less of an improvement to 50.0.
During the last ten years there has been a 67% correlation between the level of the ISM index and three month growth in factory sector industrial production.
All of the component series improved m/m with the exception of inventories. The new orders component rose to 52.1 with a 3.4 point increase that just recouped the November decline. Production also recovered its November drop and rose to 51.8 but the new export orders index fell 54.3, its lowest level since July. The series peak was in early 2004 near 60. During the last ten years there has been a 69% correlation between the level of the export order index and the q/q growth in goods exports from the GDP accounts. The imports index also fell moderately.
What Will the Next Export Boom Look Like? Some Lessons from the Late 1980s from the Federal Reserve Bank of Philadelphia can be found here.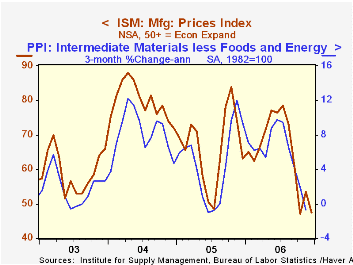
Employment also improved modestly to 49.7, the third month in the last four below the break even level of 50. During the last ten years there has been a 77% correlation between the level of the ISM employment Index and the three month growth in factory sector employment.
The price index, which is not included in the composite, gave back about all of its November rise and fell to the second lowest level since 2002.
During the last ten years there has been an 89% correlation between the level of the price index and the three month change in the PPI for intermediate goods less food & energy.
| ISM Manufacturing Survey | December | November | Dec. '06 | 2006 | 2005 | 2004 |
|---|---|---|---|---|---|---|
| Composite Index | 51.4 | 49.5 | 55.6 | 53.9 | 55.5 | 60.5 |
| Prices Index (NSA) | 47.5 | 53.5 | 63.0 | 65.0 | 66.4 | 79.8 |
by Tom Moeller January 3, 2007
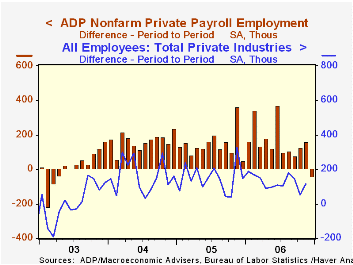
The ADP Nat'l Employment Report, reported by the payroll processor, indicated that private nonfarm payrolls declined 40,000 last month. It was the first decline since April 2003. The U.S. Bureau of Labor Statistics employment figure will be published this Friday.
Last month, ADP's measure of private nonfarm payrolls for November indicated a 158,000 rise in jobs that was followed by a BLS report that private nonfarm payrolls rose 114,000.
ADP compiled the estimate from its database of individual companies' payroll information. Macroeconomic Advisers, LLC, the St. Louis economic consulting firm, developed the methodology for transforming the raw data into an economic indicator.
According to ADP and Macro Advisers, the correlation between the monthly percentage change in the ADP estimate and that in the BLS data is 0.90.
The ADP National Employment Report data is maintained in Haver's USECON database; historical data go back to December 2000. The figures in this report cover only private sector jobs and exclude employment in the public sector, which rose an average 11,083 during the last twelve months.
The full ADP National Employment Report can be found here, and the ADP methodology is explained here.
| LAXEPA@USECON | December | November | Y/Y | 2006 | 2005 | 2004 |
|---|---|---|---|---|---|---|
| Nonfarm Private Payroll Employment (Chg.) | -40,000 | 158,000 | 1.6% | 1.8% | 1.7% | 1.3% |
by Tom Moeller January 3, 2007
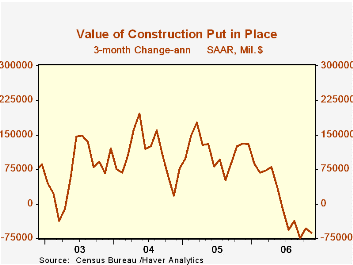
The value of construction put in place in November fell 0,2% though the prior month's sharp drop was revised to more mild 0.3% dip. Nevertheless, it was the sixth decline in the last seven months. Consensus expectations had been for a 0.5% November decline.
Residential building again fell sharply. The 1.6% decline was the eighth consecutive monthly decline and it lowered the level of residential construction activity 11.3% below last December's peak. New single family building dropped 3.1% after a 3.8% slip during October and it lowered activity 20.8% below the peak this past February. Spending on improvements again made up for some that lost work and rose 0.6% (6.7% y/y).
During the last twenty years there has been an 84% correlation between the q/q change in the value of residential building and its contribution to growth in real GDP.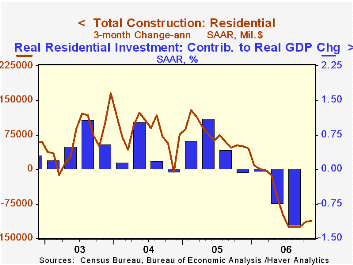
Housing: Boom or Bubble? from the Federal Reserve Bank of Philadelphia is available here.
Nonresidential building rose 1.4% after an upwardly revised 0.5% October uptick. Lodging construction surged 3.9% (71.4% y/y) after a 7.8% October spike and office construction rose a solid 1.0% (30.9% y/y) after an upwardly revised October gain. Multi-retail building eased 0.6% (28.3% y/y) and gave back half of October's increase.
Public construction spending increased 1.0% after an upwardly revised 1.9% October surge. Spending on highways & streets, nearly one third of the value of public construction spending, ticked up 0.4% (13.7% y/y) but October's gain was revised up to 2.5%.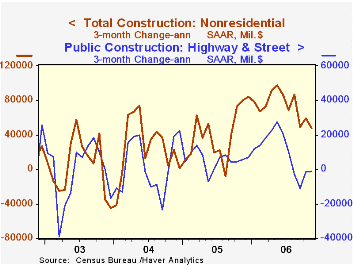
These more detailed categories represent the Census Bureau’s reclassification of construction activity into end-use groups. Finer detail is available for many of the categories; for instance, commercial construction is shown for Automotive sales and parking facilities, drugstores, building supply stores, and both commercial warehouses and mini-storage facilities. Note that start dates vary for some seasonally adjusted line items in 2000 and 2002 and that constant-dollar data are no longer computed.
| Construction Put-in-place | November | October | Y/Y | 2005 | 2004 | 2003 |
|---|---|---|---|---|---|---|
| Total | -0.2% | -0.3% | 0.1% | 10.7% | 11.5% | 5.6% |
| Private | -0.6% | -1.0% | -2.7% | 12.0% | 14.3% | 6.4% |
| Residential | -1.6% | -1.7% | -11.1% | 13.9% | 18.6% | 12.8% |
| Nonresidential | 1.4% | 0.5% | 18.0% | 7.4% | 5.3% | -4.8% |
| Public | 1.0% | 1.9% | 10.6% | 6.2% | 2.8% | 2.9% |
by Tom Moeller January 3, 2007
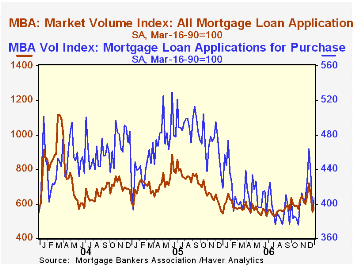
The total number of mortgage applications ticked up 3.6% last week after two weeks of sharp decline which left the average level of applications in December up 1.1% versus the prior month, according to the Mortgage Bankers Association.
Purchase applications rose 4.3% following two weeks of sharp decline but increased 4.7% during the month from the November average which rose 6.4% from the October level.
During the last ten years there has been a 58% correlation between the y/y change in purchase applications and the change in new plus existing single family home sales.
Applications to refinance also ticked up 2.2% after two weeks of double digit decline which gave back more than all some earlier increases. In December applications to refinance were unchanged on average from November.
The effective interest rate on a conventional 30-year mortgage increased again w/w to 6.40%, the highest level since early November. Nevertheless rates averaged 6.28% in December, down versus 6.36% during November. The peak for 30 year financing was 7.08% late in June. Rates for 15-year financing also increased to 6.18% and averaged 6.05% last month versus 6.13% during November. Interest rates on 15 and 30 year mortgages are closely correlated (>90%) with the rate on 10 year Treasury securities.
During the last ten years there has been a (negative) 79% correlation between the level of applications for purchase and the effective interest rate on a 30-year mortgage.
The Mortgage Bankers Association surveys between 20 to 35 of the top lenders in the U.S. housing industry to derive its refinance, purchase and market indexes. The weekly survey covers roughly 50% of all U.S. residential mortgage applications processed each week by mortgage banks, commercial banks and thrifts. Visit the Mortgage Bankers Association site here.
| MBA Mortgage Applications (3/16/90=100) | 12/29/06 | 12/22/06 | Y/Y | 2006 | 2005 | 2004 |
|---|---|---|---|---|---|---|
| Total Market Index | 575.6 | 555.8 | 5.4% | 584.2 | 708.6 | 735.1 |
| Purchase | 406.9 | 390.2 | -2.7% | 406.9 | 470.9 | 454.5 |
| Refinancing | 1,640.4 | 1,604.6 | 20.3% | 1,634.0 | 2,092.3 | 2,366.8 |
by Tom Moeller January 3, 2007
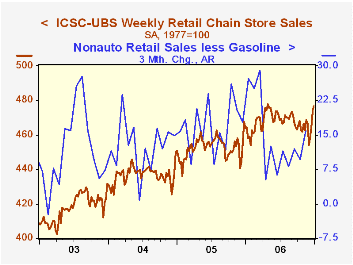
The ICSC-UBS retail chain-store sales index is constructed using the same-store sales (stores open for one year) reported by 78 stores of seven retailers: Dayton Hudson, Federated, Kmart, May, J.C. Penney, Sears and Wal-Mart.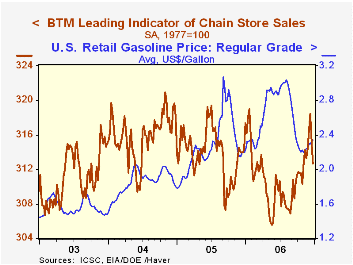
The leading indicator of chain store sales from ICSC-UBS, however, repeated its 0.9% decline of the prior week and was down 0.5% from a year ago. The decline may be attributable to the further increase in retail gasoline prices which rose to $2.34 cents per gallon in the latest week, up fourteen cents from the recent low.
| ICSC-UBS (SA, 1977=100) | 12/30/06 | 12/23/06 | Y/Y | 2005 | 2004 | 2003 |
|---|---|---|---|---|---|---|
| Total Weekly Chain Store Sales | 476.8 | 475.4 | 2.8% | 3.6% | 4.7% | 2.9% |
by Carol Stone January 3, 2007
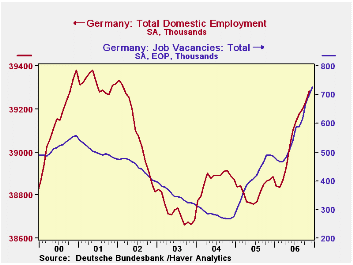
The German labor markets look quite firm, according to labor force and unemployment data reported today for November and December.
Total employment in November was 39.28 million, up 46,000 from October and 411,000 or 1.1% from November 2005. It has risen every month since January (seasonally adjusted). Annual revisions were included in this release, altering some prior employment levels and unemployment rates. The general pattern is not affected, however.
The number of job vacancies remains supportive to further employment growth. At 728,000 in December (seasonally adjusted), these rose 27,000 in the month and are up substantially from 486,000 a year ago.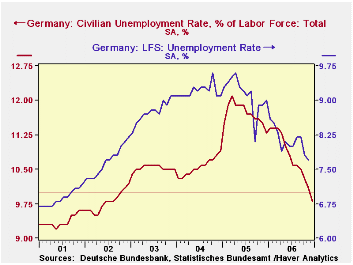
The unemployment situation has gained greater clarity in the last couple of months. When we last examined the German labor data two months ago, the ILO-based definition had shown some hesitation and remained above a recent low, even as the so-called "registered unemployment" measure was coming down. Now, the ILO rate has hit a new low, 7.7% of the labor force and the lowest since July 2002. This is off 1.2% from November 2005. The Germans' preferred measure, the "registered" unemployment rate, dipped below 10% to 9.8%, its first move into single digits since September 2002. This latter move is all the more significant for definitional changes in early 2005 that raised the level of reported unemployment. So the rate on this "new" basis is now well below many months calculated on the "old" basis and in fact is just 0.6% above its 2001 cycle low.
These labor market data correspond to results of recent business surveys in Germany, which we have described elsewhere as showing "growing optimism". They also mirror the improving employment readings in the purchasing manager surveys covering November; the manufacturing sector eased fractionally in its December results (reported yesterday), but remained in the high range of last spring. Taken together, it all seems to be showing improving conditions in Germany.
| Germany: Seas Adj, ex as noted | Dec 2006 | Nov 2006 | Oct 2006 | Year Ago | 2005 | 2004 | 2003 |
|---|---|---|---|---|---|---|---|
| LFS Employment (mil) | -- | 39.28 | 39.24 | 38.87 | 38.82 | 38.88 | 38.72 |
| Change (thous) | -- | +46 | +35 | +411 | -53 | +151 | -368 |
| Yr/Yr % Chg NSA | -- | +1.1 | -0.1 | +0.4 | -0.9 | ||
| Unemployment Rate (%, ILO Def.) | -- | 7.7 | 7.8 | 8.9 | 9.1 | 9.2 | 8.8 |
| Registered Unemployment Rate (%) | 9.8 | 10.1 | 10.3 | 11.3 | 10.8 | 11.7 | 10.6 |
| Job Vacancies (thous) | 728 | 701 | 671 | 486 | 413 | 284 | 352 |

Tom Moeller
AuthorMore in Author Profile »Prior to joining Haver Analytics in 2000, Mr. Moeller worked as the Economist at Chancellor Capital Management from 1985 to 1999. There, he developed comprehensive economic forecasts and interpreted economic data for equity and fixed income portfolio managers. Also at Chancellor, Mr. Moeller worked as an equity analyst and was responsible for researching and rating companies in the economically sensitive automobile and housing industries for investment in Chancellor’s equity portfolio. Prior to joining Chancellor, Mr. Moeller was an Economist at Citibank from 1979 to 1984. He also analyzed pricing behavior in the metals industry for the Council on Wage and Price Stability in Washington, D.C. In 1999, Mr. Moeller received the award for most accurate forecast from the Forecasters' Club of New York. From 1990 to 1992 he was President of the New York Association for Business Economists. Mr. Moeller earned an M.B.A. in Finance from Fordham University, where he graduated in 1987. He holds a Bachelor of Arts in Economics from George Washington University.
More Economy in Brief


