 Global| May 11 2007
Inventories slow further… they decline
Summary
The inventory picture has cleared a bit in recent months. We can now see that we in the grip on an inventory liquidation cycle. But how firmly are we in this grip? How much will it squeeze? And for how long? This month inventories [...]
The inventory picture has cleared a bit in recent months. We can now see that we in the grip on an inventory liquidation cycle. But how firmly are we in this ‘grip?’ How much will it squeeze? And for how long?
This month inventories fell. Since Jan of 2000 inventories have dropped in a month only 26 times; that’s about 30% of the time. But the bulk of those declines came in recession or leading up to it. Fully 13 of them came in the 15-months from January of 2000 when inventories fell 13 times as sales fell m/m in eight of those months. In 2003 things slowed again and from Dec of 2002 sales dropped five times through August as inventories fell in seven distinct months. So inventory drops are not isolated events but rather they are a response to weak sales. AND to say this is to say that firms take a concentrated effort to pare inventories on those occasions since weak or falling sales if not responded to will make inventories grow, not shrink, unless the slowing was fully anticipated.
Outside of these strings of weakness inventory drops occur only about 10% of the time. Not all sales and inventory declines are bunched together. In March as overall inventories fell by 0.1%, sales were rising at a strong 1.4%. However, sales have seen some weakness lately as they did fall by 0.9% last in January 2007, and in Sept and Oct of 2006 before that. Sales clearly have weakened and Yr/Yr business sales are now running at a 3.7% pace up from a low of 1.6% in January but well below the growth of 7% to 8% that persisted from March 2004 until about August of last year.
So one question we are looking to address is whether this is one of those improbable 10% drops in inventories or whether it is something else. It looks to be ‘something else’ (unfortunately) but that ‘something else’ does not appear to be very severe.
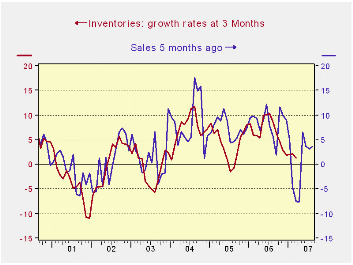
The chart above shows the time series growth relationship between inventories and sales growth rates at 3-Mos. Sales growth rates are led by five months. On this basis a very regular pattern emerges between sales and inventories. This framework suggests that sales slowdowns are unanticipated and take about five months for firms to recognize them and take action. We are currently in our weakest sales period since late 2003. If we look at the next five months of sales (plotted ahead here due to the lag), 3-mo growth is set to rise from -7.4% to +6.6% and settle in at +3.3%. That should be enough to restore inventory growth to positive. We can see that what is in progress here is the inventory cycle. While the recent sales downdraft was sharp, the period of negative growth rates was brief and sales are growing again. We have every reason to believe that this inventory correction will be mild and short.
The table above puts inventory to sales trends in perspective. It shows that MFG is the only sector with lingering I:S problems. That is to say, in MFG, sales growth is still weaker than Inventory growth; indeed sales, over the past three months are still declining. Not surprisingly I:S ratios in MFG are in the top 80% of their three Yr range (far right of table). But retail stocks are lean, residing in the bottom 10% of their three year I:S ratios. Wholesale stocks are mildly low relative to sales in the bottom one-third of their 3-Yr range.
As a result we see the inventory cycle as having a few months to run yet. Whether it is done depends on sales continuing to grow, however. Sales growth rates have built steadily for retail sector and are back at 7% over 3-Months for retailers. Wholesalers have been steady at 7% to 8% over three months, six months and a year. Manufacturers are the problem. Their sales have slumped and flattened and are still declining. But inventories are still growing raising the prospect of adjustment yet to come to this sector. And, of course most of our monthly economic readings come from this troubled sector not from the more healthy ones.
| 2007 Mar | 2007 Feb | 2006 Dec | ||||
| Sales | Inventory | Sales | Inventory | Sales | Inventory | |
| Total Business | 3.5% | 1.3% | 3.1% | 2.1% | 3.7% | 2.0% |
| Manufacturers | -2.9% | 0.9% | -3.7% | 1.0% | -0.6% | 1.7% |
| Retailers | 7.2% | -1.5% | 7.3% | 2.3% | 6.0% | 0.2% |
| Wholesalers | 7.7% | 5.3% | 7.2% | 3.0% | 6.7% | 4.9% |

Robert Brusca
AuthorMore in Author Profile »Robert A. Brusca is Chief Economist of Fact and Opinion Economics, a consulting firm he founded in Manhattan. He has been an economist on Wall Street for over 25 years. He has visited central banking and large institutional clients in over 30 countries in his career as an economist. Mr. Brusca was a Divisional Research Chief at the Federal Reserve Bank of NY (Chief of the International Financial markets Division), a Fed Watcher at Irving Trust and Chief Economist at Nikko Securities International. He is widely quoted and appears in various media. Mr. Brusca holds an MA and Ph.D. in economics from Michigan State University and a BA in Economics from the University of Michigan. His research pursues his strong interests in non aligned policy economics as well as international economics. FAO Economics’ research targets investors to assist them in making better investment decisions in stocks, bonds and in a variety of international assets. The company does not manage money and has no conflicts in giving economic advice.
More Economy in Brief


