 Global| Feb 26 2004
Initial Jobless Insurance Claims Tick Up
by:Tom Moeller
|in:Economy in Brief
Summary
Initial claims for jobless insurance rose by 6,000 (1.7%) to 350,000 last week, spot on Consensus expectations. The prior week's level was unrevised. During the last ten years there has been a 79% (negative) correlation between the [...]
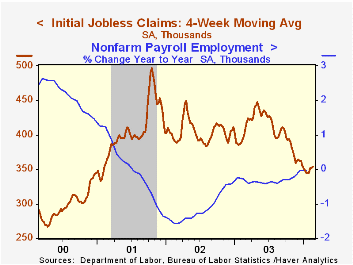
Initial claims for jobless insurance rose by 6,000 (1.7%) to 350,000 last week, spot on Consensus expectations. The prior week's level was unrevised.
During the last ten years there has been a 79% (negative) correlation between the level of initial claims and the y/y change in non-farm payrolls.
The four-week moving average of initial claims rose slightly 354,750 (-11.1% y/y).
Continuing claims for unemployment insurance fell 62,000 w/w and the prior week's level was revised lower.
The insured rate of unemployment was unchanged at 2.5%.
| Unemployment Insurance (000s) | 2/21/04 | 2/14/04 | Y/Y | 2003 | 2002 | 2001 |
|---|---|---|---|---|---|---|
| Initial Claims | 350.0 | 344.0 | -15.0% | 403 | 404 | 406 |
| Continuing Claims | -- | 3,102 | -7.9% | 3,535 | 3,575 | 3,022 |
by Tom Moeller February 26, 2004
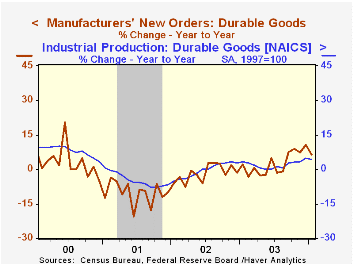
Durable goods orders fell last month by 1.8%, but orders in December were revised to a 1.6% increase from the previously reported unchanged reading. Consensus expectations had been for a 1.4% rise in January orders.
Nondefense capital goods orders excluding aircraft and parts jumped 3.6% (+11.1% y/y) and the prior month's previously reported slight decline was revised to a 3.8% surge .
Orders for computers & electronic products jumped 7.1% and the prior month was revised to a slight rise from the 2.7% drop reported initially.
Orders for electrical equipment, appliances & components jumped 3.7% (1.0% y/y) following two months of decline. Machinery orders fell 1.9% (+13.6% y/y) after four months of strong gain.
Excluding the volatile transportation sector durable goods orders rose 2.0% (8.9% y/y) to the highest level since early 2001. Transportation equipment orders fell 10.4% (+0.8% y/y) as aircraft orders slumped 30.2%.
Shipments of durable goods fell slightly m/m (+6.1% y/y) following four months of gain. Excluding transportation shipments rose 1.1% (8.3% y/y).
Durable inventories rose 0.1% for the third gain in four months.
"What Accounts for the Postwar Decline in Economic Volatility" from the Federal Reserve Bank of Philadelphia can be found here.
| NAICS Classification | Jan | Dec | Y/Y | 2003 | 2002 | 2001 |
|---|---|---|---|---|---|---|
| Durable Goods Orders | -1.8% | 1.6% | 6.6% | 2.5% | -1.7% | -10.5% |
| Nondefense Capital Goods | 1.5% | 4.0% | 10.6% | 5.6% | -7.2% | -15.5% |
by Tom Moeller February 26, 2004
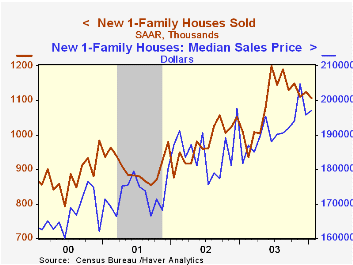
Sales of new single family homes fell a slight 1.7% to 1.106M in January but sales in December were revised up. Since the peak last June sales have fallen 7.8%. Consensus estimates were for sales of 1.100M in January.
Sales fell in each of the country's regions except the Midwest.
The median price of a new home rose a slight 0.6% m/m to $197,000 (8.4% y/y).
These new home sales data from the US Census Department reflect current sales versus the existing home sale figures which reflect closings on past sales.
| Homes Sales (000s, AR) | Jan | Dec | Y/Y | 2003 | 2002 | 2001 |
|---|---|---|---|---|---|---|
| New Single-Family | 1,106 | 1,125 | 9.6% | 1,091 | 977 | 907 |
by Tom Moeller February 26, 2004
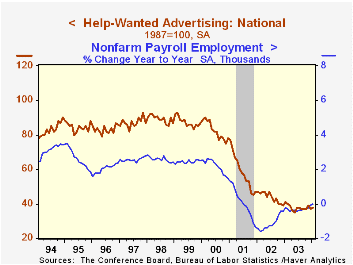
The Conference Board’s National Index of Help-Wanted Advertising ticked up to 38 last month versus a downwardly revised December reading of 37. The latest figure was equal to the 2003 average.
During the last ten years there has been a 93% correlation between the level of help-wanted advertising and the year-to-year change in non-farm payrolls.
The proportion of labor markets with rising want-ad volume improved to 57% from 29% in December, but that was just even with last January.
The Conference Board surveys help-wanted advertising volume in 51 major newspapers across the country every month.
| Conference Board | Jan | Dec | Jan '03 |
|---|---|---|---|
| National Help Wanted Index | 38 | 37 | 41 |

Tom Moeller
AuthorMore in Author Profile »Prior to joining Haver Analytics in 2000, Mr. Moeller worked as the Economist at Chancellor Capital Management from 1985 to 1999. There, he developed comprehensive economic forecasts and interpreted economic data for equity and fixed income portfolio managers. Also at Chancellor, Mr. Moeller worked as an equity analyst and was responsible for researching and rating companies in the economically sensitive automobile and housing industries for investment in Chancellor’s equity portfolio. Prior to joining Chancellor, Mr. Moeller was an Economist at Citibank from 1979 to 1984. He also analyzed pricing behavior in the metals industry for the Council on Wage and Price Stability in Washington, D.C. In 1999, Mr. Moeller received the award for most accurate forecast from the Forecasters' Club of New York. From 1990 to 1992 he was President of the New York Association for Business Economists. Mr. Moeller earned an M.B.A. in Finance from Fordham University, where he graduated in 1987. He holds a Bachelor of Arts in Economics from George Washington University.
More Economy in Brief


