 Global| Sep 21 2006
Initial Jobless Insurance Claims Rose More Than Expected
by:Tom Moeller
|in:Economy in Brief
Summary
Initial claims for unemployment insurance rose 7,000 last week to 318,000 reversing two weeks of moderate decline. Consensus expectations had been for 310,000 claims. Last year, claims surged in the aftermath of Hurricane Katrina. The [...]
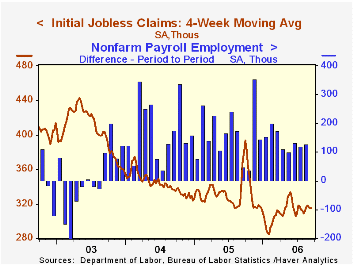
Initial claims for unemployment insurance rose 7,000 last week to 318,000 reversing two weeks of moderate decline. Consensus expectations had been for 310,000 claims. Last year, claims surged in the aftermath of Hurricane Katrina.
The latest figure covers the survey period for September nonfarm payrolls and filings rose 4,000 (1.3%) from the August period.
During the last ten years there has been a (negative) 78% correlation between the level of initial claims and the m/m change in nonfarm payroll employment.
The four-week moving average of initial claims was unchanged at 315,000 (-15.0% y/y).
Continuing claims for unemployment insurance fell 29,000 after a 9,000 increase the prior week that was half the rise initially reported.
The insured rate of unemployment was steady at 1.9% where it has been since February.
Would an Inflation Target Help Anchor U.S. Inflation Expectations? from the Federal Reserve Bank of San Francisco can be found here.
| Unemployment Insurance (000s) | 9/16/06 | 9/09/06 | Y/Y | 2005 | 2004 | 2003 |
|---|---|---|---|---|---|---|
| Initial Claims | 318 | 311 | -24.5% | 332 | 343 | 403 |
| Continuing Claims | -- | 2,461 | -6.9% | 2,662 | 2,924 | 3,532 |
by Tom Moeller September 21, 2006
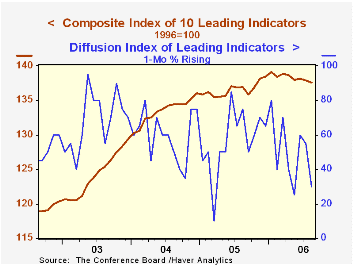
The composite index of leading economic indicators fell 0.2% in August for the second month. It was the fifth m/m decline in the index reported by the Conference Board this year and matched Consensus expectations.
During the last ten years there has been a 59% correlation between the y/y change in the leading indicators and the lagged change in real GDP.
The breadth of one month gain amongst the 10 components of the leading index fell to 30%, the lowest level since May but the percentage of components that rose over a six month span improved marginally to 50%.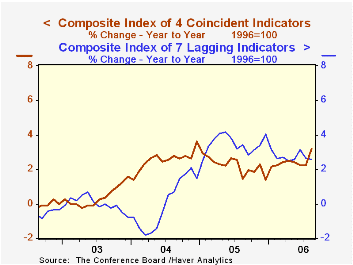
The method of calculating the contribution to the leading index from the spread between 10 year Treasury securities and the Fed funds rate has been revised. A negative contribution will now occur only when the spread inverts rather than when declining as in the past. More details can be found here.
The leading index is based on eight previously reported economic data series. Two series, orders for consumer goods and orders for capital goods, are estimated.
The coincident indicators increased 0.1% after an unrevised 0.2% July gain. During the last six months all of the coincident series rose but in August the one month percentage increasing slipped to 75%. Over the last ten years there has been a 91% correlation between the y/y change in the coincident indicators and real GDP growth.
The lagging indicators rose 0.3% as C&I loans rose. Nevertheless, the ratio of coincident to lagging indicators which is a measure of actual economic performance versus excess fell.
Visit the Conference Board's site for coverage of leading indicator series from around the world.
Do Households Benefit from Financial Deregulation and Innovation? The Case of the Mortgage Market from the Federal Reserve Bank of Boston is available here.
| Business Cycle Indicators | August | July | Y/Y | 2005 | 2004 | 2003 |
|---|---|---|---|---|---|---|
| Leading | -0.2% | -0.2% | 0.4% | 2.3% | 7.4% | 5.0% |
| Coincident | 0.1% | 0.2% | 3.2% | 2.2% | 2.5% | 0.4% |
| Lagging | 0.3% | -0.2% | 2.6% | 3.5% | 0.0% | -0.0% |
by Tom Moeller September 21, 2006
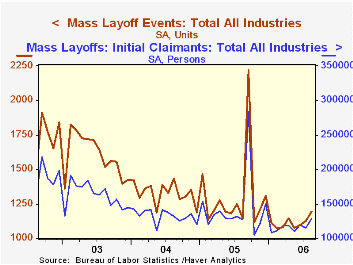
In August, the number of mass layoff events rose for the third consecutive month. The 6.0% m/m increase pulled the y/y comparison positive for the first time since December.
During the last ten years there has been a (negative) 85% correlation between the three month average level of layoff announcements and the y/y change in payroll employment.
The number of persons affected last month by mass layoffs surged 11.4% m/m but were up just 0.3% y/y. The number of persons affected by mass layoffs during the first eight months of this year fell 12.6% from the first eight months of 2005.
Increased layoffs in manufacturing (21.2% y/y) and information (-35.0% y/y) dominated the increase in claimants for unemployment insurance last month. Declines elsewhere were widespread.
The Mass Layoff Statistics (MLS) program collects reports on mass layoff actions that result in workers being separated from their jobs. Monthly mass layoff numbers are from establishments which have at least 50 initial claims for unemployment insurance (UI) filed against them during a 5-week period.
| Mass Layoffs | August | July | Y/Y | 2005 | 2004 | 2003 |
|---|---|---|---|---|---|---|
| All US Industries (# Events, SA) | 1,193 | 1,125 | 4.2% | 15,699 | 15,926 | 19,220 |
| Total (# Persons, SA) | 127,944 | 114,895 | 0.3% | 1,722,452 | 1,591,081 | 1,946,548 |
by Tom Moeller September 21, 2006
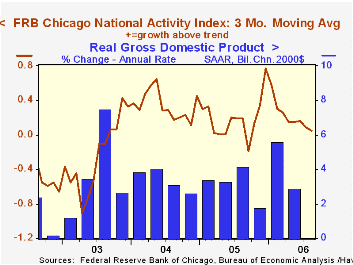
The August National Activity Index (CFNAI) from the Federal Reserve Bank of Chicago at -0.18 was negative for the third month in the last four and that was enough to pull the three-month moving average of the CFNAI fell to 0.05, its lowest level in over a year.
A zero value of the CFNAI indicates that the economy is expanding at its historical trend rate of growth and during the last twenty years there has been a 68% correlation between the level of the CFNAI and q/q growth in real GDP.
The CFNAI is a weighted average of 85 indicators of economic activity. The indicators reflect activity in the following categories: production and income, the labor market, personal consumption and housing, manufacturing and trade sales, and inventories & orders.
The latest CFNAI report is available here.
| Chicago Fed | August | July | August '05 | 2005 | 2004 | 2003 |
|---|---|---|---|---|---|---|
| CFNAI | -0.18 | -0.07 | 0.13 | 0.20 | 0.35 | -0.15 |
by Tom Moeller September 21, 2006
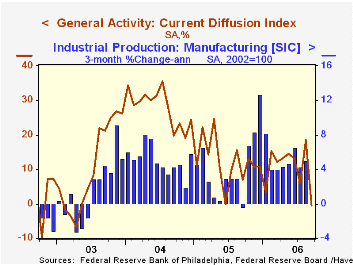
The Philadelphia Federal Reserve Bank's September Index of General Business Conditions in the manufacturing sector was negative for the first month since April 2003. The figure fell to -0.4 from an unrevised, very firm 18.5 in August. Consensus expectations had been for a slight decline to 14.8.
During the last ten years there has been a 65% correlation between the level of the Philadelphia Fed Business Conditions Index and three month growth in factory sector industrial production. There has been a 49% correlation with q/q growth in real GDP.
With the exceptions of inventories and employment, each of the sub indexes turned negative in September. The employment index, in fact, rose back into the middle of its range of the last year. During the last ten years there has been a 75% correlation between the employment index and the three month growth in factory payrolls.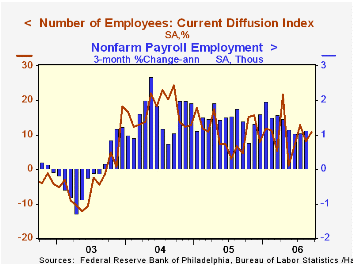
The business conditions index reflects a separate survey question, not the sub indexes.
The prices paid index dropped further m/m to the lowest level since April. During the last ten years there has been a 76% correlation between the prices paid index and the three month growth in the intermediate goods PPI. There has been an 85% correlation with the change in core intermediate goods prices.
The separate index of expected business conditions in six months also was negative for the first month since January 2001, though expectations for orders, shipments and employment remained positive.
The latest Business Outlook survey from the Philadelphia Federal Reserve Bank can be found here.
| Philadelphia Fed Business Outlook | September | August | Sept '05 | 2005 | 2004 | 2003 |
|---|---|---|---|---|---|---|
| General Activity Index | -0.4 | 18.5 | 7.0 | 12.4 | 28.0 | 10.5 |
| Prices Paid Index | 38.1 | 45.3 | 50.6 | 43.5 | 51.2 | 16.8 |
by Carol Stone September 21, 2006
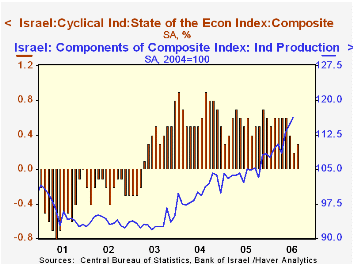
The Israel's Central Statistics Bureau today reported its "State of the Economy Index" for August, along with its available components. When we last checked in on the Israeli economy, about six weeks ago, the war in Lebanon was still in full swing and in describing Q2 GDP, we wondered out loud what the war would do to the economy in Q3. Today's report gives a bit of an indication. The overall index is estimated to have risen 0.3% in each July and August, marginally less than June's 0.4%, but noticeably less than the 0.6%/month in each of the prior four months. So some slowdown is clearly in process.
The index has five components covering industry, domestic and foreign trade and employment in the business sector (about 70% of total employment). Only exports and imports are published yet for August, and both of these are more than keeping up with their average of the past year. Imports grew 5.2% in August compared with a 12-month average gain of 1.4% and exports were up 3.5% versus an average of 1.1%. Industrial production through July was continuing with some strength as well, with monthly increases well over 1% then and in June, compared with 0.9% monthly for the last 12 months.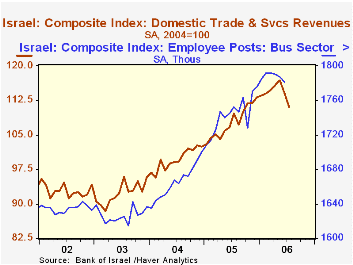
The slowing is more evident in demand and employment indicators. The employment data lag, with the latest values only covering June and a detailed industrial breakdown only through Q2. But business sector employment by this monthly indicator peaked in March and fell slightly in each of the following months. Since this information is all prior to the Lebanon war, there is no impact evident here. Further, employment had expanded with some vigor since early in 2004. So perhaps there is nothing more in the recent pattern than a pause after a strong uptrend.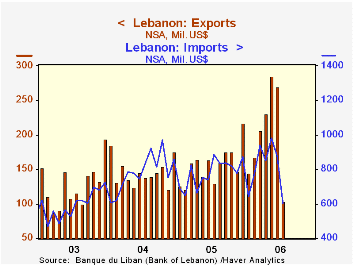
Domestic sales, however, seem to be a different story. Revenues from trade and services dropped 2.5% in June and another 2.6% in July, erasing almost all of a nice rise over the nine months beginning last September. People could well hold back purchases or at least take a cautionary stance as political tensions mount. Fortuitously for their welfare, a truce was called quickly, and this likely helps the general economy as well.
In dramatic contrast, the impact of the war showed quickly and distinctly in Lebanon. Data offerings are fairly sparse, but a quick look at imports and exports, which were reported Monday by the Bank of Lebanon, shows a clear picture of significant economic damage. The third graph here tells the whole story.
| Israel: SA, % Chg | Weight (%) | Aug 2006 | July 2006 | June 2006 | Yr Ago (Mo. Avg) | Yearly % Change|||
|---|---|---|---|---|---|---|---|---|
| 2005 | 2004 | 2003 | ||||||
| Total Index | 100 | 0.3 | 0.3 | 0.4 | 0.5 | 7.1 | 6.9 | -0.7 |
| Industrial Production | 28 | -- | 1.3 | 1.6 | 0.9 | 4.6 | 7.2 | -0.3 |
| Imports | 15 | 5.2 | 2.4 | -2.3 | 1.4 | 2.3 | 14.6 | -4.8 |
| Trade & Services Revenues | 28 | -- | -2.6 | -2.5 | 0.1 | 8.1 | 8.0 | -0.6 |
| Employees in Business Sector | 19 | -- | -- | -0.3 | 0.2 | 4.7 | 2.4 | -0.5 |
| Exports | 10 | 3.5 | -10.2 | 9.4 | 1.1 | 7.1 | 17.4 | 4.4 |

Tom Moeller
AuthorMore in Author Profile »Prior to joining Haver Analytics in 2000, Mr. Moeller worked as the Economist at Chancellor Capital Management from 1985 to 1999. There, he developed comprehensive economic forecasts and interpreted economic data for equity and fixed income portfolio managers. Also at Chancellor, Mr. Moeller worked as an equity analyst and was responsible for researching and rating companies in the economically sensitive automobile and housing industries for investment in Chancellor’s equity portfolio. Prior to joining Chancellor, Mr. Moeller was an Economist at Citibank from 1979 to 1984. He also analyzed pricing behavior in the metals industry for the Council on Wage and Price Stability in Washington, D.C. In 1999, Mr. Moeller received the award for most accurate forecast from the Forecasters' Club of New York. From 1990 to 1992 he was President of the New York Association for Business Economists. Mr. Moeller earned an M.B.A. in Finance from Fordham University, where he graduated in 1987. He holds a Bachelor of Arts in Economics from George Washington University.
More Economy in Brief


