 Global| Oct 28 2004
Initial Jobless Insurance Claims Rose
by:Tom Moeller
|in:Economy in Brief
Summary
Initial claims for unemployment insurance last week recouped most of the prior period's decline with a 20,000 rise to 350,000 following a 25,000 decline that was little revised. The Consensus expectation had been for 340,000 claims. [...]
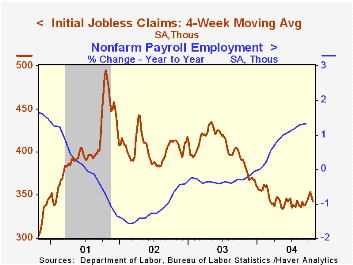
Initial claims for unemployment insurance last week recouped most of the prior period's decline with a 20,000 rise to 350,000 following a 25,000 decline that was little revised. The Consensus expectation had been for 340,000 claims.
During the last ten years there has been a (negative) 73% correlation between the level of initial claims and the m/m change in payroll employment.
The 4-week moving average of initial claims fell to 343,250 (-11.6% y/y).
Continuing claims for unemployment insurance rose 38,000 after sharp declines during five of the prior six weeks.
The insured rate of unemployment remained at 2.2% for the third week.
| Unemployment Insurance (000s) | 10/23/04 | 10/16/04 | Y/Y | 2003 | 2002 | 2001 |
|---|---|---|---|---|---|---|
| Initial Claims | 350 | 330 | -9.3% | 402 | 404 | 406 |
| Continuing Claims | -- | 2,823 | -19.5% | 3,531 | 3,570 | 3,018 |
by Tom Moeller October 28, 2004
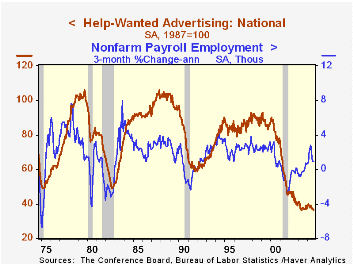
The National Index of Help-Wanted Advertising published by the Conference Board fell to 36 in September, the lowest level since May of last year.
The proportion of labor markets with rising want-ad volume plunged to 25%, half the prior month's level and the lowest since March.
During the last ten years there has been an 89% correlation between the level of help-wanted advertising and the year-to-year change in non-farm payrolls.
Recent weakness in help wanted indicates that most, if not all, of the improvement in non-farm payroll growth has been due to fewer job losses, not improved hiring and explains why the recent three month growth in payrolls of 0.9% is well below the growth which characterized other US economic recovery periods.
The Conference Board surveys help-wanted advertising volume in 51 major newspapers across the country every month.
| Conference Board | Sept | Aug | Sept '03 |
|---|---|---|---|
| National Help Wanted Index | 36 | 37 | 37 |
by Tom Moeller October 28, 2004
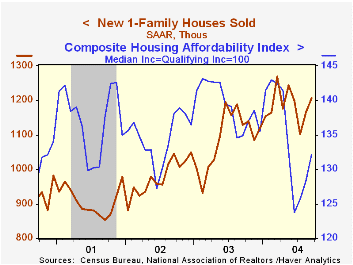
Sales of new single-family homes rose 3.5% in September to 1.206M, the highest level since May. Consensus estimates had been for sales of 1.150M.
Sales rose in each of the country's regions except the West where a 0.8% (+9.1% y/y) decline followed a 10.1% August jump. In the South sales rose 2.7% (4.3% y/y) and in the Northeast sales rose 6.0% (-19.3% y/y). Sales in the Midwest jumped 12.3% (22.7% y/y).
The median price of a new single family home fell 8.4% m/m to $197,700 (3.0% y/y).
| Homes Sales (000s, AR) | Sept | Aug | Y/Y | 2003 | 2002 | 2001 |
|---|---|---|---|---|---|---|
| New Single-Family | 1,206 | 1,165 | 7.0% | 1,089 | 976 | 907 |

Tom Moeller
AuthorMore in Author Profile »Prior to joining Haver Analytics in 2000, Mr. Moeller worked as the Economist at Chancellor Capital Management from 1985 to 1999. There, he developed comprehensive economic forecasts and interpreted economic data for equity and fixed income portfolio managers. Also at Chancellor, Mr. Moeller worked as an equity analyst and was responsible for researching and rating companies in the economically sensitive automobile and housing industries for investment in Chancellor’s equity portfolio. Prior to joining Chancellor, Mr. Moeller was an Economist at Citibank from 1979 to 1984. He also analyzed pricing behavior in the metals industry for the Council on Wage and Price Stability in Washington, D.C. In 1999, Mr. Moeller received the award for most accurate forecast from the Forecasters' Club of New York. From 1990 to 1992 he was President of the New York Association for Business Economists. Mr. Moeller earned an M.B.A. in Finance from Fordham University, where he graduated in 1987. He holds a Bachelor of Arts in Economics from George Washington University.
More Economy in Brief


