 Global| Sep 18 2003
Initial Jobless Insurance Claims Below 400,000
by:Tom Moeller
|in:Economy in Brief
Summary
Initial claims for jobless insurance fell an unexpectedly sharp 29,000 to 399,000 last week. The prior week's level was revised up. Consensus expectations had been for claims of 410,000. During the last ten years there has been a 80% [...]
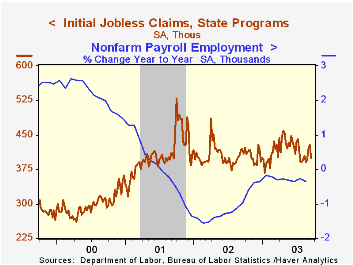
Initial claims for jobless insurance fell an unexpectedly sharp 29,000 to 399,000 last week. The prior week's level was revised up. Consensus expectations had been for claims of 410,000.
During the last ten years there has been a 80% correlation (inverse) between the level of initial claims and the y/y change in payroll employment.
The four-week moving average of initial claims rose to 410,750 (-0.1% y/y), the highest level since July, as a result of increases during the prior three weeks.
Continuing claims for unemployment insurance rose 39,000 to 3,683,000. The sharp 61,000 gain reported for the prior week was revised to a less steep 37,000.
The insured rate of unemployment held steady at 2.9%. The rate has averaged 2.9% since April.
| Unemployment Insurance (000s) | 9/13/03 | 9/6/03 | Y/Y | 2002 | 2001 | 2000 |
|---|---|---|---|---|---|---|
| Initial Claims | 399.0 | 428.0 | -4.8% | 404.3 | 406.0 | 299.7 |
| Continuing Claims | -- | 3,683 | 3.0% | 3,575 | 3,022 | 2,114 |
by Tom Moeller September 18, 2003
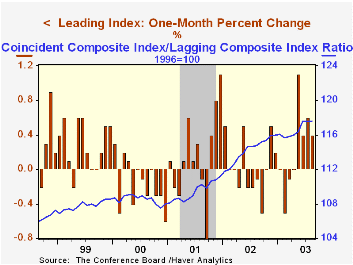
The Conference Board reported that the Composite Index of Leading Economic Indicators rose for the fourth consecutive month in August. The 0.4% gain was as expected. The prior month's increase was revised up to 0.6% from 0.4% reported last month.
Gains amongst the leaders' component series eased to 45%. The diffusion of the prior month's gain was revised up to 70% from 50%. The percentage of leading components rising over a six month period rose to 85%, the highest level since January 2002.
A steeper yield curve, a higher money supply, higher building permits and stronger vendor performance had significant positive influences on the leading index. Negative influences from the other leading series were modest.
The Leading index is based on eight previously reported economic data series and two that are estimated.
The coincident indicators were unchanged following three months of slight increase.
The ratio of coincident-to-lagging indicators was unchanged for the second month at a record high level. The ratio is an indicator of excess relative to actual economic performance.
Visit the Conference Board's site for coverage of leading indicator series from around the world.
James H. Stock and Robert W. Watson ask "How Did Leading Indicator Forecasts Perform During the 2001 Recession" in this paper published by the Federal Reserve Bank of Richmond.
| Business Cycle Indicators | Aug | July | Y/Y | 2002 | 2001 | 2000 |
|---|---|---|---|---|---|---|
| Leading | 0.4% | 0.6% | 2.2% | 2.1% | -0.9% | 1.0% |
| Coincident | 0.0% | 0.2% | 0.1% | -0.2% | -0.4% | 3.4% |
| Lagging | 0.0% | 0.1% | -2.3% | -4.4% | -1.3% | 2.8% |
by Tom Moeller September 18, 2003
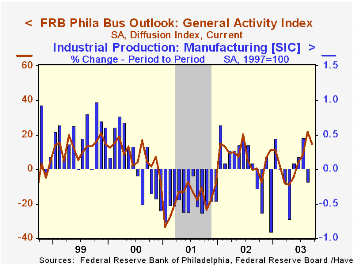
The Philadelphia Fed’s August index of general business conditions fell in September to 14.6 from 22.1 in August. Consensus expectations were for a reading of 17.5.
During the last twenty years there has been a 65% correlation between the level of the Philadelphia Fed Business Conditions Index and quarterly growth in real GDP. The correlation with quarterly growth in factory sector industrial production has been 77%.
Declines amongst the sub indexes were not broad based. The new orders, unfilled orders and employment indexes each improved, new orders to a cycle high.
Shipments and the factory workweek fell modestly.
The business conditions index reflects a separate survey question, not the sub indexes.
A separate survey of expected business conditions in six months rose to 66.2, the highest level since 1991.
The prices paid index rose further to 22.5.
The Philadelphia Fed index is based on a survey of 250 regional manufacturing firms, but these firms sell nationally and internationally.
The latest Business Outlook survey from the Philadelphia Federal Reserve Bank can be found here.
| Philadelphia Fed Business Outlook | Sept | Aug | Sept '02 | 2002 | 2001 | 2000 |
|---|---|---|---|---|---|---|
| General Activity Index | 14.6 | 22.1 | 0.4 | 7.7 | -17.2 | 8.3 |
| Prices Paid Index | 22.5 | 16.0 | 20.5 | 12.2 | -0.9 | 27.2 |

Tom Moeller
AuthorMore in Author Profile »Prior to joining Haver Analytics in 2000, Mr. Moeller worked as the Economist at Chancellor Capital Management from 1985 to 1999. There, he developed comprehensive economic forecasts and interpreted economic data for equity and fixed income portfolio managers. Also at Chancellor, Mr. Moeller worked as an equity analyst and was responsible for researching and rating companies in the economically sensitive automobile and housing industries for investment in Chancellor’s equity portfolio. Prior to joining Chancellor, Mr. Moeller was an Economist at Citibank from 1979 to 1984. He also analyzed pricing behavior in the metals industry for the Council on Wage and Price Stability in Washington, D.C. In 1999, Mr. Moeller received the award for most accurate forecast from the Forecasters' Club of New York. From 1990 to 1992 he was President of the New York Association for Business Economists. Mr. Moeller earned an M.B.A. in Finance from Fordham University, where he graduated in 1987. He holds a Bachelor of Arts in Economics from George Washington University.
More Economy in Brief


