 Global| Jun 22 2006
Initial Claims for Unemployment Insurance Up Slightly
by:Tom Moeller
|in:Economy in Brief
Summary
Initial unemployment insurance claims increased 11,000 to 308,000 last week. The rise followed a decline of 6,000 the week prior that was slightly shallower than initially estimated and about matched Consensus expectations for 309,000 [...]
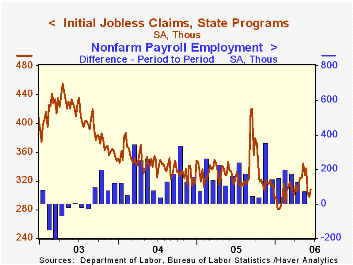
Initial unemployment insurance claims increased 11,000 to 308,000 last week. The rise followed a decline of 6,000 the week prior that was slightly shallower than initially estimated and about matched Consensus expectations for 309,000 claims.
The latest figure covers the survey period for June nonfarm payrolls and claims fell 36,000 (-10.5%) from the May period.
During the last ten years there has been a 78% (negative) correlation between the level of initial claims and the m/m change in payroll employment.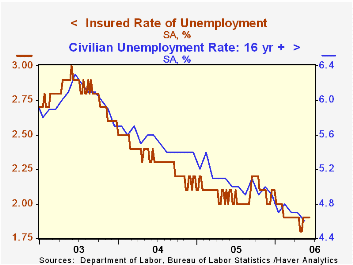
The four-week moving average of initial claims dropped to 311,250 (-6.7% y/y).
Continuing claims for unemployment insurance rose 18,000 following a downwardly revised 11,000 increase the previous week.
The insured rate of unemployment remained stable at 1.9% for the fifth consecutive week.
Ups and Downs: How Wages Change Over the Business Cycle from the Federal Reserve Bank of Philadelphia is available here.
| Unemployment Insurance (000s) | 06/17/06 | 06/10/06 | Y/Y | 2005 | 2004 | 2003 |
|---|---|---|---|---|---|---|
| Initial Claims | 308 | 297 | -4.3% | 332 | 343 | 403 |
| Continuing Claims | -- | 2,439 | -6.8% | 2,663 | 2,923 | 3,530 |
by Tom Moeller June 22, 2006
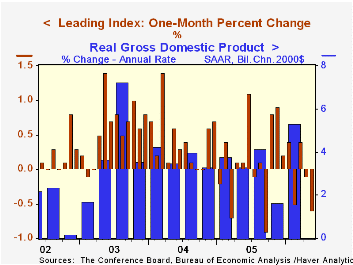
The May Composite Index of Leading Economic Indicators fell 0.6% last month after an unrevised 0.1% dip during April, reported the Conference Board. Consensus expectations had been for a 0.4% decline and it was the third drop in the last four months.
Six month growth in the leaders fell to -0.4%, its weakest since early 2001. During the last ten years there has been a 43% correlation between the six-month change in the leading indicators and quarterly growth in real GDP.
The breadth of one month gain amongst the 10 components of the leading index fell to 30% in May but over a six month span 50% of the index components rose, the weakest breadth of six month gain in a year. The only positive contributions to the May index were from higher orders for consumer goods and for capital goods as well as a more positive interest rate spread.
The method of calculating the contribution to the leading index from the spread between 10 year Treasury securities and the Fed funds rate has been revised. A negative contribution will now occur only when the spread inverts rather than when declining as in the past. More details can be found here.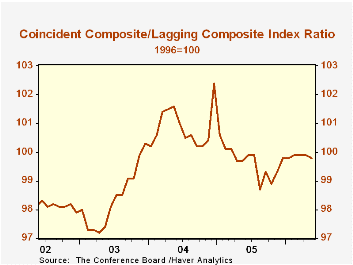
The leading index is based on eight previously reported economic data series. Two series, orders for consumer goods and orders for capital goods, are estimated.
The coincident indicators ticked up 0.1% following four consecutive months of 0.2% gain. Of the four component series, 75% rose last month after two months when all the components rose. During the last six months all of the coincident series rose and over the last ten years there has been a 69% correlation between the change in the coincident indicators and real GDP growth.
The lagging indicators rose 0.2% for the third consecutive month. During May, 64.3% of the series' components rose and during the last six months 42.9% rose. The ratio of coincident to lagging indicators, a measure of actual economic performance versus excess, fell slightly.
Visit the Conference Board's site for coverage of leading indicator series from around the world.
Transparency, Expectations, and Forecasts from the Federal Reserve Bank of Atlanta is available here.
| Business Cycle Indicators | May | April | 6 Month Chg., AR | 2005 | 2004 | 2003 |
|---|---|---|---|---|---|---|
| Leading | -0.6% | -0.1% | 2.9% | 2.3% | 7.4% | 5.0% |
| Coincident | 0.1% | 0.2% | 3.5% | 2.2% | 2.5% | 0.4% |
| Lagging | 0.2% | 0.2% | 1.6% | 3.5% | 0.0% | -0.0% |
by Carol Stone June 22, 2006
Total production of petroleum products has surged in the last several weeks, and refineries are operating at their highest capacity since before last September's hurricanes. These statements are based on weekly petroleum supply statistics provided by the Energy Information Administration of the Department of Energy; just in the last month, Haver Analytics has begun to seasonally adjust these data, using the same software routine used by the Fed for the money supply and other weekly data. The raw figures are contained in the OILWKLY and WEEKLY databases, and the seasonally adjusted data are in WEEKLY. 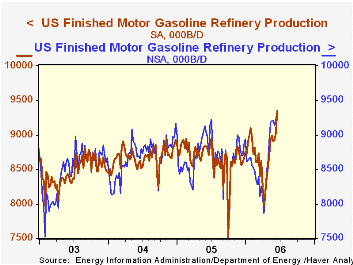
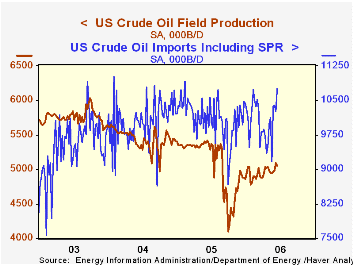
Domestic crude oil production continues its long downtrend. It was 5.05 million barrels/day (mil B/D) last week, compared with 5.10 mil B/D the week before and 5.38 mil B/D in the comparable 2005 week. So far during 2006, it has averaged 4.95 mil B/D, off 10% from 5.41 mil B/D in 2004. Domestic oil, of course, isn't nearly enough to meet today's energy needs in the US, and crude oil imports ran to 10.7 mil B/D last week, up almost exactly 8.0% from a year earlier. 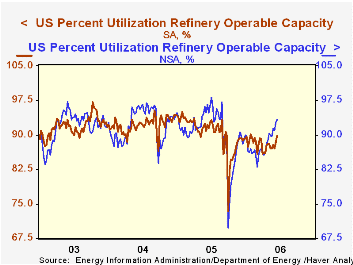
US refiners are producing more gasoline than ever, 9.34 mil B/D in the June 16 week, up 3.5% just in one week. The seasonal adjustment process is especially helpful here in smoothing the late winter/early spring slowdown due to refinery maintenance and then adjusting out the consequent rebound. This highlights the import of the latest week's jump: it's not due to some standard late-spring advance in gasoline output. Underlying gains in refinery output are also more evident in the refinery capacity utilization data, which also benefit from the seasonal adjustment. Last week's seasonally adjusted usage rate was 89.85%, which, except for one week in January, is the highest since late September 2005, just before Hurricane Rita.So gradually refiners are getting their capacity back on-stream. A hopeful note for limiting capacity pressures on product prices is that there are still a couple of percentage points of slack compared to pre-2005 levels, which were running between 91% and 92%.
| Thous B/D, Seasonally Adjusted* |
June 16, 2006 | June 9, 2006 | May 19, 2006 | June 17, 2005 | 2005 | 2004 | 2003 |
|---|---|---|---|---|---|---|---|
| Domestic Crude Oil Production | 5,052 | 5,095 | 4,937 | 5,380 | 4,861 | 5,410 | 5,640 |
| Crude Oil Imports | 10,749 | 10,267 | 9,166 | 9,929 | 10,111 | 10,044 | 9,511 |
| Refinery Gasoline Production | 9,343 | 9,028 | 8,991 | 8,707 | 8,662 | 8,681 | 8,471 |
| Refinery Capacity Utilization (%) | 89.85 | 88.45 | 87.05 | 91.49 | 90.29 | 82.24 | 91.83 |

Tom Moeller
AuthorMore in Author Profile »Prior to joining Haver Analytics in 2000, Mr. Moeller worked as the Economist at Chancellor Capital Management from 1985 to 1999. There, he developed comprehensive economic forecasts and interpreted economic data for equity and fixed income portfolio managers. Also at Chancellor, Mr. Moeller worked as an equity analyst and was responsible for researching and rating companies in the economically sensitive automobile and housing industries for investment in Chancellor’s equity portfolio. Prior to joining Chancellor, Mr. Moeller was an Economist at Citibank from 1979 to 1984. He also analyzed pricing behavior in the metals industry for the Council on Wage and Price Stability in Washington, D.C. In 1999, Mr. Moeller received the award for most accurate forecast from the Forecasters' Club of New York. From 1990 to 1992 he was President of the New York Association for Business Economists. Mr. Moeller earned an M.B.A. in Finance from Fordham University, where he graduated in 1987. He holds a Bachelor of Arts in Economics from George Washington University.
More Economy in Brief


