 Global| Dec 29 2005
Initial Claims for Jobless Insurance Inched Up
by:Tom Moeller
|in:Economy in Brief
Summary
Initial claims for unemployment insurance fell 3,000 to 322,000 last week following a little revised 12,000 decline the prior week. Consensus expectations had been for 325,000 claims. During the last ten year there has been a [...]
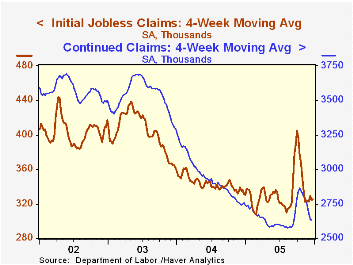
Initial claims for unemployment insurance fell 3,000 to 322,000 last week following a little revised 12,000 decline the prior week. Consensus expectations had been for 325,000 claims.
During the last ten year there has been a (negative) 75% correlation between the level of initial jobless insurance claims and the m/m change in payroll employment.
The four-week moving average of initial claims was little changed at 325,000 (-1.7% y/y).
Continuing unemployment insurance claims increased a sharp 85,000 following a 36,000 rise the prior week which was little different than initially reported.
The insured rate of unemployment remained at 2.1%.
International Capital Flows and U.S. Interest Rates from the Federal Reserve Board is available here.
| Unemployment Insurance (000s) | 12/24/05 | 12/17/05 | Y/Y | 2004 | 2003 | 2002 |
|---|---|---|---|---|---|---|
| Initial Claims | 322 | 319 | -0.6% | 343 | 402 | 404 |
| Continuing Claims | -- | 2,715 | -1.2% | 2,926 | 3,531 | 3,570 |
by Tom Moeller December 29, 2005
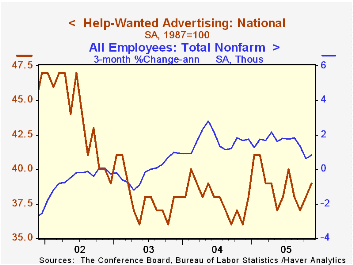
The Conference Board's November Index of Help-Wanted Advertising rose to 39 from an unrevised level of 38 in October. A pattern of improvement in the labor market has emerged this year as the index's level has averaged 39 versus 38 for all of 2004.
During the last ten years there has been a 62% correlation between the level of help-wanted advertising and the three month change in non-farm payrolls.
The proportion of labor markets with rising want-ad volume ran counter to that improvement and fell in November to 47% from 65% in October which was near the year's high.
The Conference Board surveys help-wanted advertising volume in 51 major newspapers across the country every month.
The latest help wanted report from the Conference Board is available here.
| Conference Board | Nov | Oct | Nov '04 |
|---|---|---|---|
| National Help Wanted Index | 39 | 38 | 36 |
by Tom Moeller December 29, 2005
The Baby Boom: Predictability in House Prices and Interest Rates from the Federal Reserve Board can be found here.
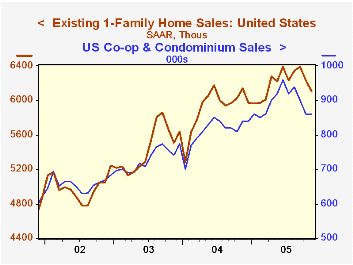
| Existing Home Sales (000, AR) | Nov | Oct | Y/Y | 2004 | 2003 | 2002 |
|---|---|---|---|---|---|---|
| Total Home Sales | 6,970 | 7,090 | -0.1% | 6,723 | 6,170 | 5,653 |
| Single Family Home Sales | 6,110 | 6,230 | -0.5% | 5,913 | 5,441 | 4,995 |
| Single Family Median Home Price ($,000) | $213.5 | $21 6.7 | 13.5% | $182.8 | $169.1 | $157.6 |
by Carol Stone December 29, 2005
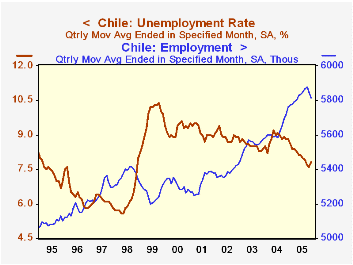
The active sectors of the Chilean economy seem to have moderated a bit in the last couple of months, but are still keeping up favorable comparisons with a year ago. Total employment decreased 34,000 in November and 30,000 in October, but stands 1.7% ahead of November 2004, the same as the growth for 2004 as a whole. These data are reported as 3-month moving averages and seasonally adjusted by Haver Analytics. Within the National Statistics Bureau industry breakdown is a public service-type category "communal, social and personal services". If we subtract this group from the total, the remainder might be seen as a proxy for the overall private sector; it shows somewhat more slowing, with decreases for the last three months and only a 0.7% gain over the last year. The unemployment rate ticked higher in November, rising to 7.8% from 7.6% in October. However, this latter was the lowest figure since late 1998, as the world financial crisis was pushing it steeply higher, and it is down from a peak of 10.4% in late 1999.
One often thinks of mining when considering the Chilean economy, but mining and quarrying represents only 1.3% of its employment. Even so, this modest workforce generates about 7.3% of Chile's GDP. Otherwise, the mix of employment has, as in many other western countries, shifted over the last few years toward service industries, with growth in finance and transportation and communication, as well as the aforementioned "communal, social and personal services". Agriculture, while diminishing in recent years, still holds a sizable share of total jobs, about one in eight.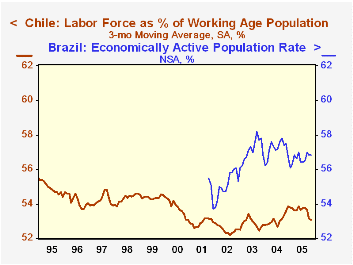
At the outset, we noted that these data refer to the "active" sectors of the Chilean economy; that distinction is notable, because there is a substantial "inactive" sector. Labor force participation is only about 53% of the population over age 15 and the employment/population ratio was just under 49% last month. These figures contrast with the US, where the labor force is 66% and employment 62.7% of the relevant population age range. Perhaps this is an unfair comparison and we should assess economic participation with Chile's neighbors: in Argentina, the urban population had a 45% participation rate in Q3 and a 40% employment rate and in Brazil, 56.8% and 51.3% for the relevant population segments. While the Brazilian numbers look favorable compared with Chile's, they refer to a sampling of metropolitan area populations which represent only about 22% of Brazil's total population of about 176,000,000. So from a broader perspective, Chile's population can be seen as the most economically active of these three major Latin American nations.
| Chile: 3-mo Moving Avg* | Nov 2005 | Oct 2005 | Sept 2005 | Nov 2004 | 2004 | 2003 | 2002 |
|---|---|---|---|---|---|---|---|
| Employment | 5.815 | 5.849 | 5.879 | 5.178 | 5.632 | 5.537 | 5.381 |
| Change (000) | -34 | -30 | +11 | 1.7% | 1.7% | 2.9% | 1.1% |
| "Private" Sector** | 4.151 | 4.173 | 4.205 | 4.121 | 4.069 | 4.024 | 3.903 |
| Change (000) | -23 | -32 | -3 | 0.7% | 1.1% | 3.1% | 1.9% |
| Unemployment Rate | 7.8 | 7.6 | 7.7 | 8.8 | 8.8 | 8.5 | 8.9 |

Tom Moeller
AuthorMore in Author Profile »Prior to joining Haver Analytics in 2000, Mr. Moeller worked as the Economist at Chancellor Capital Management from 1985 to 1999. There, he developed comprehensive economic forecasts and interpreted economic data for equity and fixed income portfolio managers. Also at Chancellor, Mr. Moeller worked as an equity analyst and was responsible for researching and rating companies in the economically sensitive automobile and housing industries for investment in Chancellor’s equity portfolio. Prior to joining Chancellor, Mr. Moeller was an Economist at Citibank from 1979 to 1984. He also analyzed pricing behavior in the metals industry for the Council on Wage and Price Stability in Washington, D.C. In 1999, Mr. Moeller received the award for most accurate forecast from the Forecasters' Club of New York. From 1990 to 1992 he was President of the New York Association for Business Economists. Mr. Moeller earned an M.B.A. in Finance from Fordham University, where he graduated in 1987. He holds a Bachelor of Arts in Economics from George Washington University.
More Economy in Brief


