 Global| Mar 20 2003
Initial Claims for Jobless Insurance Firm
by:Tom Moeller
|in:Economy in Brief
Summary
Initial claims for unemployment insurance fell less than expected last week, down 0.9% from the prior week's level which was revised up. Expectations were for claims of 415,000. It was the second consecutive weekly decline in initial [...]

Initial claims for unemployment insurance fell less than expected last week, down 0.9% from the prior week's level which was revised up. Expectations were for claims of 415,000. It was the second consecutive weekly decline in initial claims but they remained above the 400,000 level for the fifth straight week.
Claims in the latest week covered the March survey period for nonfarm payrolls. Initial claims were up 15,000 (3.7%) from the February survey period.
The four-week moving average of initial claims rose to 424,750, up 7.7% y/y. During the last ten years there has been a 72% correlation (inverse) between the level of initial claims and the three month growth in nonfarm payrolls.
Continuing claims for unemployment insurance rose 1.9% following little change the prior week which was revised down. It was the highest level for continuing claims since mid-November.
The insured rate of unemployment rose slightly to 2.8% from the prior week's level that was revised down from 2.8% to 2.7%.
| Unemployment Insurance (000s) | 3/15/03 | 3/08/03 | Y/Y | 2002 | 2001 | 2000 |
|---|---|---|---|---|---|---|
| Initial Claims | 421.0 | 425.0 | 7.9% | 405.0 | 405.8 | 299.8 |
| Continuing Claims | -- | 3,548 | 0.1% | 3,588 | 3,021 | 2,114 |
by Tom Moeller March 20, 2003
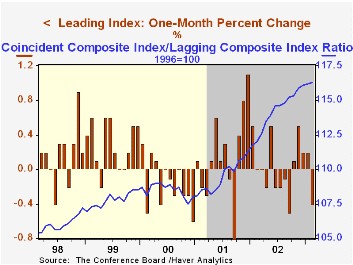
The Conference Board reported that the Composite Index of Leading Economic Indicators fell last month, as expected. The prior month's previously reported decline was revised to a slight gain.
Gains amongst the leaders' component series narrowed significantly to 35%, the leanest breadth of gain since September. The percentage of leading components rising over a six month period rose slightly to a still-low 40%.
Higher initial claims for jobless insurance, lower stock prices and lower consumer expectations had the largest negative influences on theFebruary leading index. That was offset somewhat on the upside by a higher money supply. The influence of most other components was near zero.
The Leading index is based on eight previously reported economic data series and two that are estimated.
The coincident indicators were unchanged and remained in 1Q just 0.7% (AR) above the 4Q average. During the last twenty years there has been an 80% correlation between the quarterly change in the coincident indicators and quarterly growth in real GDP.
The ratio of coincident-to-lagging indicators rose just slightly by 0.1% for the second month. The ratio is an indicator of excess relative to actual economic performance.
Visit the Conference Board's site for coverage of leading indicator series from around the world as well as a recent survey of consumer investment attitudes.
| Business Cycle Indicators | Feb | Jan | Y/Y | 2002 | 2001 | 2000 |
|---|---|---|---|---|---|---|
| Leading | -0.4% | 0.2% | 0.1% | 2.2% | -0.9% | 1.0% |
| Coincident | 0.0% | 0.2% | 1.0% | -0.2% | -0.4% | 3.4% |
| Lagging | -0.1% | 0.1% | -2.7% | -4.4% | -1.3% | 2.8% |
by Tom Moeller March 20, 2003
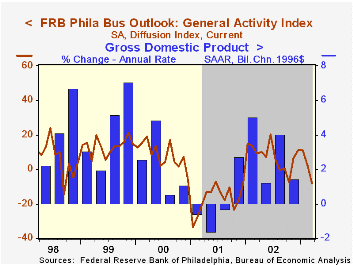
The Philadelphia Fed’s index of general business conditions weakened more than expected this month. It fell to -8.0 versus Consensus expectations for a decline to 0.0 from 2.3 in February. This was the first month negative since October.
The decline was in line with the fall in the Empire State Factory survey reported earlier this week.
During the last twenty years there has been a 68% correlation between the level of the Business Conditions Index and growth in real GDP. The correlation with quarterly growth in industrial production has been 78%.
Amongst the sub indexes new orders, employment and the length of the workweek fell significantly. Inventories and delivery lead times improved.
The business conditions index reflects a separate survey question, not the components.
Prices paid strengthened to the highest level since October 2000.
The Philadelphia Fed index is based on a survey of 250 regional manufacturing firms, but these firms sell nationally and internationally.
The latest Business Outlook survey from the Philadelphia Fed can be found here.
| Philadelphia Fed Business Outlook | Mar | Feb | Y/Y | 2002 | 2001 | 2000 |
|---|---|---|---|---|---|---|
| General Activity Index | -8.0 | 2.3 | 9.2 | 7.7 | -17.2 | 8.3 |
| Prices Paid Index | 25.1 | 16.2 | 2.6 | 12.2 | -0.9 | 27.2 |
by Tom Moeller March 20, 2003

The US budget last month came in near Consensus expectations for a $93.0 bil. deficit. The deficit deepened sharply from last year's figure. For the first five months of FY03, the federal government ran a deficit of $193.9 bil. versus a $147.1 bil. deficit during the first five months of FY02.
Net receipts for the first five months of FY03 fell 8.2% versus last year. Individual tax payments fell 11.4%. Corporate income taxes were down 47.7%. Social insurance contributions were up 3.3%.
Federal expenditures rose 7.6% versus last fiscal year's first five months. Defense spending was up 16.7%. Spending on health programs rose 10.0% and spending on education rose 16.6%. Spending on income security was up 14.3% as the unemployment rate remained high. On the weak side were Social Security outlays, up 4.3%, and interest expense which fell 7.4% y/y.
Analysis of the President's latest budget proposal by the Congressional Budget Office is available here.
| US Government Finance | Feb | Jan | Feb '02 | FY2002 | FY2001 | FY2000 |
|---|---|---|---|---|---|---|
| Budget Balance | $-96.3B | $11.1B | $-76.1B | $-157.8B | $127.3B | $236.4B |
| Revenues | $89.5B | $187.9B | -8.6% | -6.9% | -1.7% | 10.8% |
| Outlays | $185.8B | $176.8B | 6.8% | 7.9% | 4.2% | 5.1% |

Tom Moeller
AuthorMore in Author Profile »Prior to joining Haver Analytics in 2000, Mr. Moeller worked as the Economist at Chancellor Capital Management from 1985 to 1999. There, he developed comprehensive economic forecasts and interpreted economic data for equity and fixed income portfolio managers. Also at Chancellor, Mr. Moeller worked as an equity analyst and was responsible for researching and rating companies in the economically sensitive automobile and housing industries for investment in Chancellor’s equity portfolio. Prior to joining Chancellor, Mr. Moeller was an Economist at Citibank from 1979 to 1984. He also analyzed pricing behavior in the metals industry for the Council on Wage and Price Stability in Washington, D.C. In 1999, Mr. Moeller received the award for most accurate forecast from the Forecasters' Club of New York. From 1990 to 1992 he was President of the New York Association for Business Economists. Mr. Moeller earned an M.B.A. in Finance from Fordham University, where he graduated in 1987. He holds a Bachelor of Arts in Economics from George Washington University.
More Economy in Brief


