 Global| Apr 10 2003
Initial Claims for Jobless Insurance Fell
by:Tom Moeller
|in:Economy in Brief
Summary
Initial claims for unemployment insurance last week were lower than Consensus expectations for 430,000. Claims fell 8.6% w/w to 405,000 and reversed virtually all of the prior week's jump. Claims in the prior week were revised down [...]
Initial claims for unemployment insurance last week were lower than Consensus expectations for 430,000. Claims fell 8.6% w/w to 405,000 and reversed virtually all of the prior week's jump. Claims in the prior week were revised down slightly.
Despite the decline, initial claims have been above 400,000 for eight consecutive weeks.
The four-week moving average of initial claims fell to 419,500, -3.6% y/y.
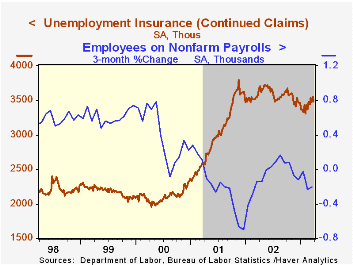
Continuing claims for unemployment insurance fell 1.9% w/w. During the last ten years there has been a 66% correlation (inverse) between the level of continued claims and the three month growth in nonfarm payrolls.
The insured rate of unemployment fell to 2.7%.
| Unemployment Insurance (000s) | 4/05/03 | 3/29/03 | Y/Y | 2002 | 2001 | 2000 |
|---|---|---|---|---|---|---|
| Initial Claims | 405.0 | 443.0 | -9.0% | 405.0 | 405.8 | 299.8 |
| Continuing Claims | -- | 3,487 | -7.0% | 3,588 | 3,021 | 2,114 |
by Tom Moeller April 10, 2003
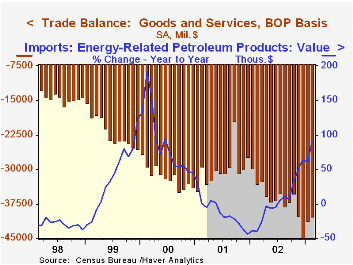
The U.S. foreign trade deficit narrowed in February for the second consecutive month. At $40.3B, the deficit was shallower than Consensus expectations for a deficit of $42.0B. January's deficit was little revised.
Exports added another 0.5% to the strong 1.7% January rise. Capital goods exports rose 5.0% (2.5% y/y), adding to the 2.6% gain in January. Food and other goods were the other sources of export strength in February.
Nonauto consumer goods exports gave back all of the gain in January with a 7.2% (0.8% y/y) decline. Exports of automotive vehicles, parts & engines rose 0.2% (5.5% y/y).
Imports fell for the second consecutive month. Capital goods imports fell 4.3% (1.5% y/y) following a 0.7% January decline. Imports of other goods and foods also fell hard. Nonauto consumer goods rose just 0.5% (10.3% y/y) following a sharp 4.1% January drop.
Imports of industrial supplies and materials rose 3.4% (36.0% y/y) but the value of energy related petroleum products fell slightly (89.6% y/y). The quantity of crude petroleum imports fell for the fifth month in six (1.5% y/y), though the per day quantity rose slightly. The per barrel price of crude petroleum rose 9.8% (83.9% y/y).
| Foreign Trade | Feb | Jan | Y/Y | 2002 | 2001 | 2000 |
|---|---|---|---|---|---|---|
| Trade Deficit | $40.3B | $41.2B | $33.2B(2/02) | $435.7B | $358.3B | $378.7B |
| Exports - Goods & Services | 0.5% | 1.7% | 6.7% | -2.6% | -6.2% | 11.2% |
| Imports - Goods & Services | -0.4% | -1.8% | 11.2% | 3.8% | -6.0% | 18.3% |
by Tom Moeller April 10, 2003
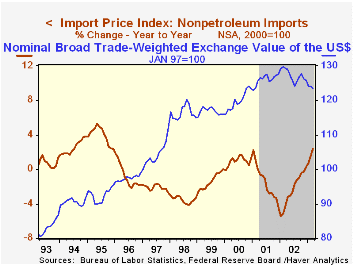
Prices for imported commodities rose 0.5% last month, right in line with Consensus expectations. The gain in prices in February was revised up due to a raised estimated of the gain in petroleum prices.
Petroleum import prices fell for the first month in four. So far in April the price of West Texas Intermediate crude has been in the $28-29/bbl range, down sharply versus $33.55/bbl averaged in March.
Nonpetroleum import prices rose by the most for any one month since January 2001 and the 0.9% gain was the record for this series. Strength centered in the foods category, up 1.3%, and in industrial supplies and materials (strong natural gas prices), up 1.8%. Prices of imported capital goods were unchanged (-1.3% y/y) and have been about unchanged since October. Nonauto consumer goods prices rose 0.1% following two months of no change (-0.1% y/y).
Export prices rose a 0.3% for the third consecutive month of strength.
| Import/Export Prices (NSA) | Mar | Feb | Y/Y | 2002 | 2001 | 2000 |
|---|---|---|---|---|---|---|
| Import - All Commodities | 0.5% | 1.7% | 6.7% | -2.5% | -3.5% | 6.5% |
| Petroleum | -1.8% | 11.1% | 52.5% | 3.0% | -17.2% | 66.5% |
| Nonpetroleum | 0.9% | 0.4% | 2.4% | -2.4% | -1.5% | 1.0% |
| Export - All Commodities | 0.3% | 0.5% | 2.2% | -1.0% | -0.8% | 1.6% |

Tom Moeller
AuthorMore in Author Profile »Prior to joining Haver Analytics in 2000, Mr. Moeller worked as the Economist at Chancellor Capital Management from 1985 to 1999. There, he developed comprehensive economic forecasts and interpreted economic data for equity and fixed income portfolio managers. Also at Chancellor, Mr. Moeller worked as an equity analyst and was responsible for researching and rating companies in the economically sensitive automobile and housing industries for investment in Chancellor’s equity portfolio. Prior to joining Chancellor, Mr. Moeller was an Economist at Citibank from 1979 to 1984. He also analyzed pricing behavior in the metals industry for the Council on Wage and Price Stability in Washington, D.C. In 1999, Mr. Moeller received the award for most accurate forecast from the Forecasters' Club of New York. From 1990 to 1992 he was President of the New York Association for Business Economists. Mr. Moeller earned an M.B.A. in Finance from Fordham University, where he graduated in 1987. He holds a Bachelor of Arts in Economics from George Washington University.


