 Global| Sep 24 2007
Inflation Fears: The Data Behind Them
by:Tom Moeller
|in:Economy in Brief
Summary
Since the Fed lowered interest rates last week, many now worry that the risk of future price inflation has risen. In fact, if the slope of the yield curve is any measure, i.e., the difference between the yield on the 10 year and 2 [...]
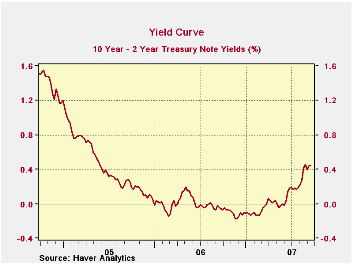
Since the Fed lowered interest rates last week, many now worry that the risk of future price inflation has risen. In fact, if the slope of the yield curve is any measure, i.e., the difference between the yield on the 10 year and 2 year Treasury notes, the credit markets began pricing in that risk last Spring.
The question is did the Fed stoke an inflation fire? Three measures of just how hot that fire is bear watching: GDP growth versus its potential, liquidity, and outside forces, i.e., the price of imported goods.
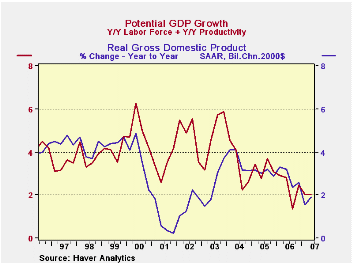
Worry #1 - Potential GDP growth usually is measured by taking the growth in the labor force and adding it to the growth in how productive that labor force is. For the U.S. economy, the slowdown in its potential rate of growth during the last few years is dramatic due to slower productivity growth. At the same time, the actual rate of economic growth has slowed as well, perhaps by enough to alleviate concerns about overheating.
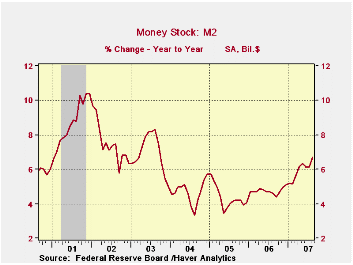
Worry #2 - Growth in liquidity, as measured by the growth in M2, has roughly doubled during the last two years to 6.5%. That may or may not be a rate of growth that is threatening, but it is up. And it has been accompanied by a moderate acceleration in the narrower measures of money growth. M1 growth is up moderately to a still negative 0.4% and a MZM has accelerated sharply to 10.4%.
Worry #3 - This one, maybe, is not so threatening. Prices for imported goods have been decelerating recently due to the past weakness in oil prices that lowered gasoline prices. This, however, is certainly threatened by the recent run-up in crude oil prices. Prices for nonpetroleum imports have been fairly tame, held back by the stability of pricing for automotive products and industrial supplies other than petroleum. What bears watching, however, is the moderate acceleration in the pricing of capital goods as well as the prices for non-automotive consumer goods.
The markets, therefore, seem to be pricing in a very real threat of higher price inflation. Measured inflation, on the other hand has been very well behaved, but that most likely is the result of the past slow growth in liquidity and the past slow growth in import prices.
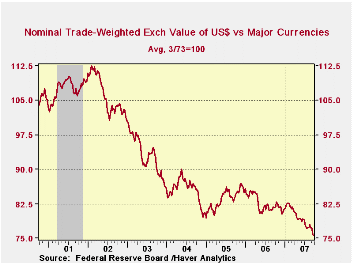
Will inflation accelerate? The answer is yet to be determined, but the recent evidence strongly suggests that it will. Over the short term, what bears watching is just how much economic growth continues to exceed its potential. Another short term factor is whether the growth in the prices of imported goods perhaps becomes more stable. The recent weakness in the trade weighted value of the U.S. dollar does not bode well for that.
All of the data used to research the above analysis are available in Haver's USECON database and the WEEKLY database.
The Effectiveness of Monetary Policy from the Federal Reserve Bank of St. Louis is available here.
How Well Does Employment Predict Output? also from the Federal Reserve Bank of St. Louis can be found here.
E-zone Orders Show a Loss in Momentum in Julyby Robert Brusca September 24, 2007
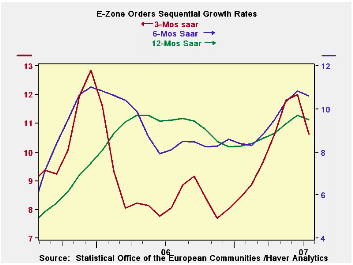
July orders are weak across the EU main countries…
In July EMU-13 orders were off by 4%, a sharp reversal of July’s 4.5% gain. In August the twin forces of the US ‘subprime’ meltdown and the Euro’s rise will be further impediments for Europe to deal with. But as of July, ahead of those forces there is already some evidence of weakening. The Yr/Yr chart and graphs show that momentum is still upward, though not as strong. Obviously when orders jump by 4.5% only to fall by 4% the next month the trend is not greatly damaged. But, injured more noticeably is the path for orders early in the new, third, quarter. Orders are off at a 4.5% pace in Q3. Meanwhile sales are still strong growing at an annual pace of 6.7% in early Q3.
In July orders are off by 7.2% in Germany, by 2.9% in France and by 0.4% in Italy. The EU’s UK, by contrast, has orders up a sharp 20.2%. Starting out the new quarter Germany shows the weakest result at -18.2%. France shows orders up by 1.3% annualized in Q3 while Italy’s orders are up at a strong 13.3%.
The EMU data reveal that domestic orders reported by the main 13-countires edged lower by 0.2%. The weakness in orders was concentrated in export orders where they dropped by 10%. We have been seeing consistent reports of weak export orders from those European countries that report them. So now the reports of weakness have hit the aggregated EMU figures.
This slowing adds to the reversals we have seen already in the FLASH PMI report (for Sept) from NTC/Reuters. The weakness in July sales is somewhat apparent in consumer goods where EU sales are off by 0.4% in July. Capital and intermediate goods are not yet showing ill effects on their sales from overall weak orders, at least not in July. The temporal shifting in many of these reports makes it harder to nail down the picture since orders sound alike they are more in vanguard than the PMI barometers but the PMI data are in fact fresher by TWO FULL MONTHS. Still, what we find is that foreign orders are dropping, domestic orders have weakened and there is a loss in industrial momentum ahead of the problems initiated in US financial markets and before the recent run-up in the Euro Vs the dollar. More of this bad news may therefore lie ahead. It’s no wonder that there are all sorts of cautionary statements about the strong Euro and its risk being bandied about.
| E-zone and UK Industrial Orders & Sales Trends | ||||||||
|---|---|---|---|---|---|---|---|---|
| Saar except m/m | % m/m | Jul-07 | Jul-07 | Jul-07 | Jul-06 | Jul-05 | ||
| E-zone Detail | Jul-07 | Jun-07 | May-07 | 3-Mo | 6-mo | 12-mo | 12-mo | 12-mo |
| MFG Orders | -4.0% | 4.5% | 1.4% | 7.0% | 7.8% | 8.0% | 9.8% | 3.7% |
| MFG Sales | 0.2% | 1.0% | 0.7% | 7.8% | 6.5% | 7.0% | 7.6% | 3.5% |
| Consumer goods | -0.4% | 0.5% | 0.4% | 1.9% | 2.5% | 3.9% | 7.6% | 3.5% |
| Capital goods | 0.9% | 0.4% | 0.4% | 7.3% | 7.3% | 8.5% | 4.1% | 2.0% |
| Intermediate goods | 0.2% | 1.0% | 0.7% | 9.0% | 10.1% | 7.8% | 6.8% | 3.1% |
| MFG Orders | ||||||||
| Total Orders | -4.0% | 4.5% | 1.4% | 7.0% | 7.8% | 8.0% | 9.8% | 3.7% |
| E-13 Domestic MFG orders | -0.2% | 1.7% | 0.6% | 9.0% | 10.1% | 7.8% | 8.8% | 1.2% |
| E-13 Foreign MFG orders | -10.0% | 8.5% | 3.5% | 4.3% | 7.9% | 8.4% | 10.1% | 6.2% |
| Countries: | Jul-07 | Jun-07 | May-07 | 3-Mo | 6-mo | 12-mo | 12-mo | 12-mo |
| Germany: | -7.2% | 4.8% | 3.2% | 1.5% | 8.3% | 6.9% | 9.7% | 8.0% |
| France: | -2.9% | 3.4% | 3.1% | 14.6% | 4.9% | 15.5% | 2.6% | -0.5% |
| Italy: | -0.4% | 2.5% | 2.5% | 20.3% | 19.5% | 7.9% | 8.7% | 8.1% |
| UK: | 20.2% | 0.0% | -0.7% | 103.8% | 62.6% | 26.0% | -0.8% | 0.7% |
by Robert Brusca September 24, 2007
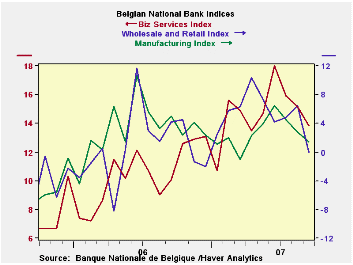
Belgium is not one of the large EU countries. But it is situated in the heart of the union and it does issue an index ahead of those issued by other EU member countries. It is the timeliness of this index and its correlation with the main Euro area indexes as well as with those of Germany that make the Belgium National Bank Indexes interesting to us. It is a timely report and serves as a decent bellwether for the Euro area.
Its sector plotting, the accompanying chart shows that the main Belgium sectors have peaked and are losing some momentum. Wholesaling and retailing has made the largest drop in September – a decline of six points. The Belgian index shows a drop in the most important sector indexes (construction excluded). In its MFG detail it shows domestic orders fall into negative territory while foreign orders are just expanding on a less widespread basis. These trends are roughly consistent with what we have been seeing in the rest of the Euro area, except through July Euro area foreign orders have been weaker than domestic orders.
| Belgium National Bank Indexes | ||||||
|---|---|---|---|---|---|---|
| Sep-07 | Aug-07 | Jul-07 | 3-Mo Change | 6-Mo Change | 12-Mo Change | |
| Total Industry | 1.5 | 3.3 | 4.2 | -4.0 | 0.1 | -3.0 |
| Manufacturing | 1.4 | 2.8 | 4.5 | -5.1 | 2.4 | -3.6 |
| Production | 0.0 | 4.0 | 4.0 | -8.0 | 0.0 | -9.0 |
| Domestic Orders | -3.0 | 1.0 | -2.0 | -8.0 | -7.0 | -8.0 |
| Foreign Orders | 8.0 | 9.0 | 14.0 | -3.0 | 11.0 | -1.0 |
| Prices | 3.0 | 2.0 | 7.0 | -10.0 | -6.0 | -10.0 |
| Current assessment | ||||||
| Total Orders | -2.0 | 0.0 | 2.0 | -5.0 | 1.0 | -8.0 |
| Foreign Orders | 1.0 | 2.0 | 4.0 | -3.0 | 4.0 | -4.0 |
| Inventories | -1.0 | 0.0 | -3.0 | 6.0 | -5.0 | -1.0 |
| -- | -- | -- | 0.0 | 0.0 | 0.0 | |
| Wholesale & Retail | 0.0 | 6.5 | 4.8 | -4.2 | -6.3 | -4.2 |
| Construction | 3.4 | 2.3 | 2.1 | 1.1 | -4.0 | 0.7 |
| Business Services | 13.8 | 15.2 | 15.9 | -4.2 | -1.1 | 3.7 |
| Comparisons: | Changes lag one month | |||||
| EU Index: Industry | #N/A | 5.0 | 5.0 | -1.0 | -2.0 | 2.0 |
| Germany Index: Industry | #N/A | 8.0 | 8.0 | -1.0 | -1.0 | 4.0 |
| Compare: BNB Index | -- | -- | -- | -0.6 | -0.5 | 0.2 |
by Louise Curley September 24, 2007
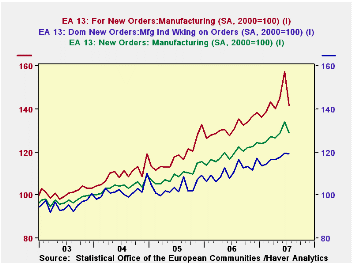
The July weakness in manufacturing new orders for the entire Euro Area is hardly a surprise. Earlier releases of data on new orders for several of the member countries were pointing in this direction. The index of new orders for manufacturing in the total Euro Area declined 4.1% from 134.2 (2000=100) in June to 128.8 in July. Most of the decline took place in foreign orders. Domestic orders declined 0.2% while foreign orders fell by 10.0%. Total, domestic and foreign new orders are shown in the first chart.
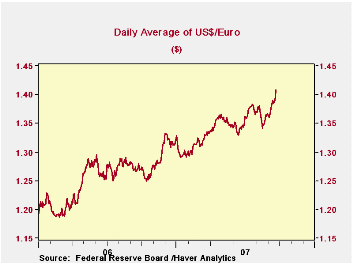
The rise in the euro has undoubtedly affected foreign orders. From the end of 2005 to the end of July of this year, the euro has risen 16% against the dollar. It has since risen a further 3% and reached an all time high of $1.409 last Thursday. The daily values of the euro in US dollars since the end of 2005 are shown in the second chart.
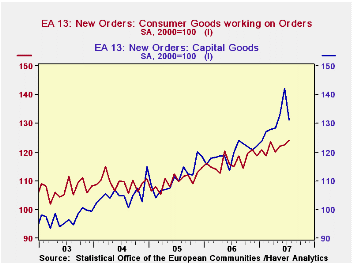
New orders for consumer goods actually rose 1.1% in July from 122.6 to 124.0. But this increase was more than offset by an 8% decline in orders for capital goods. Data on consumer and capital goods orders are shown in the third chart.
| EURO AREA INDEX OF MANUFACTURING NEW ORDERS (2000=100) | Jul 07 | Jun 07 | Jul 06 | M/M Chg | Y/Y Chg | 2006 | 2005 | 2004 |
|---|---|---|---|---|---|---|---|---|
| Total | 128.8 | 134.2 | 119.2 | -4.1 | 8.0 | 119.2 | 109.2 | 104.0 |
| Domestic | 119.3 | 119.5 | 110.7 | -0.2 | 7.8 | 111.1 | 103.6 | 101.8 |
| Foreign | 140.6 | 157.3 | 130.5 | -10.0 | 8.4 | 131.5 | 118.3 | 109.8 |
| Capital Goods Orders | 131.0 | 142.3 | 119.8 | -8.0 | 9.4 | 119.5 | 111.0 | 105.2 |
| Consumer Goods Orders | 124.0 | 122.6 | 115.0 | 1.1 | 7.8 | 116.7 | 110.0 | 109.3 |

Tom Moeller
AuthorMore in Author Profile »Prior to joining Haver Analytics in 2000, Mr. Moeller worked as the Economist at Chancellor Capital Management from 1985 to 1999. There, he developed comprehensive economic forecasts and interpreted economic data for equity and fixed income portfolio managers. Also at Chancellor, Mr. Moeller worked as an equity analyst and was responsible for researching and rating companies in the economically sensitive automobile and housing industries for investment in Chancellor’s equity portfolio. Prior to joining Chancellor, Mr. Moeller was an Economist at Citibank from 1979 to 1984. He also analyzed pricing behavior in the metals industry for the Council on Wage and Price Stability in Washington, D.C. In 1999, Mr. Moeller received the award for most accurate forecast from the Forecasters' Club of New York. From 1990 to 1992 he was President of the New York Association for Business Economists. Mr. Moeller earned an M.B.A. in Finance from Fordham University, where he graduated in 1987. He holds a Bachelor of Arts in Economics from George Washington University.
More Economy in Brief


