 Global| Apr 17 2006
Industrial Production Rose Further
by:Tom Moeller
|in:Economy in Brief
Summary
During March, overall industrial output rose another 0.6% and added to a downwardly revised 0.5% February increase. Consensus expectations had been for a 0.5% gain. Factory sector output rose 0.5% after a revised 0.2% February decline [...]
During March, overall industrial output rose another 0.6% and added to a downwardly revised 0.5% February increase. Consensus expectations had been for a 0.5% gain.
Factory sector output rose 0.5% after a revised 0.2% February decline that was initially reported as no change.
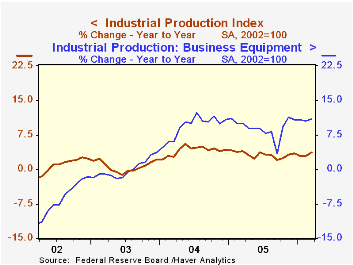
Motor vehicles & parts production rebounded 1.5% (2.7% y/y) after a 1.1% February drop. Excluding motor vehicles, factory output increased 0.4% (5.0% y/y) but a slight increase initially reported for February was revised to a slight 0.1% decline. 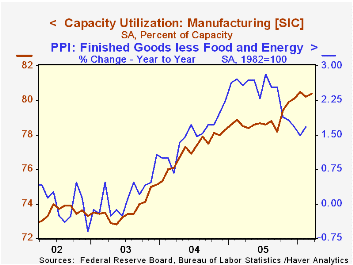
Output of computers, communication equipment and semiconductors increased 2.7% (23.2% y/y) as output of communications equipment rose 2.2% (29.6% y/y) and semiconductor production surged 3.5% (24.0% y/y). Factory output excluding both autos & high tech rose 0.3% (3.7% y/y) after the revised 0.1% February decline. For 1Q, this measure of output rose 5.2% (AR).
Output of primary metals was unchanged (3.4% y/y) but machinery output rebounded 1.4% (5.2%) following two consecutive months of sharp decline. Electrical equipment & appliance output likewise rebound from a February drop with a 0.7% increase (9.4% y/y). Output of furniture & related products rose but the 0.4% (-1.2% y/y) increase followed a 0.6% rise during February that was half the gain initially reported.
Nondurables output recovered 0.3% (1.8% y/y) following a 0.3% February drop. Apparel output surged 2.1% (6.3% y/y).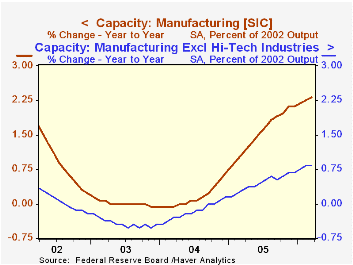
Total capacity utilization rose to 81.3% but utilization during February was revised lower. Factory sector utilization rose to 80.4% from 80.2% the prior month. During the last twenty years there has been a 36% correlation between the level of factory sector utilization and the y/y change in "core" producer prices. There also has been a 37% correlation with the change in core consumer prices.
Industrial capacity grew 0.1% (1.9% y/y) and the annual rate of growth is up from 1.3% last year and 0.3% during 2004. Factor sector capacity grew 0.2% (2.4% y/y) compared to 1.6% growth last year and 0.2% growth during 2004. Much of that growth has been in the high tech sector. Excluding high tech, factory sector capacity is up just 0.8% versus a 0.5% gain last year and a 0.2% decline the year prior.
Productivity Growth: Causes and Consequences from the Federal Reserve Bank of San Francisco is available here.
A Leaner, More Skilled U.S. Manufacturing Workforce from the Federal Reserve Bank of New York can be found here.
| Production & Capacity | Mar | Feb | Y/Y | 2005 | 2004 | 2003 |
|---|---|---|---|---|---|---|
| Total Industrial Production | 0.6% | 0.5% | 3.6% | 3.2% | 4.1% | 0.6% |
| Manufacturing | 0.5% | -0.2% | 4.8% | 3.9% | 4.8% | 0.5% |
| Consumer Goods | 0.4% | 0.7% | 1.8% | 2.1% | 2.1% | 1.0% |
| Business Equipment | 0.8% | 0.2% | 10.8% | 9.1% | 9.3% | 0.0% |
| Capacity Utilization | 81.3% | 81.0% | 79.9% (3/05) | 80.1% | 78.6% | 75.7% |
by Tom Moeller April 17, 2006
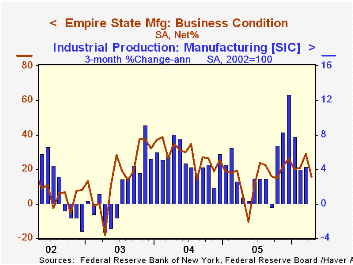
The April Empire State Index of General Business Conditions fell sharply to 15.81 from a downwardly revised March reading of 29.03. The figures are reported by the Federal Reserve Bank of New York and Consensus expectations had been for a lesser decline to 23.9.
Since the series' inception in 2001 there has been a 76% correlation between the index level and the three month change in factory sector industrial production.
Most of the index components fell in April with both orders & shipments at roughly half last month's level. The employment index, however, only gave back some of its surge in March and landed at 17.41 versus a 12.45 1Q average.
Pricing pressure fell slightly m/m and was at the lowest since lowest level since last August.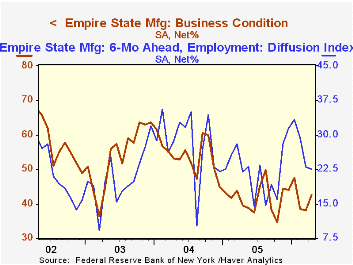
Like the Philadelphia Fed Index of General Business Conditions, the Empire State Business Conditions Index reflects answers to an independent survey question; it is not a weighted combination of the components.
The index of expectations for business conditions in six months improved following two months of decline and expectations for future capital spending rose but just slightly.
The Empire State Manufacturing Survey is a monthly survey of manufacturers in New York State conducted by the Federal Reserve Bank of New York. Participants from across the state in a variety of industries respond to a questionnaire and report the change in a variety of indicators from the previous month. Respondents also state the likely direction of these same indicators six months ahead. April 2002 is the first report, although survey data date back to July 2001.
For more on the Empire State Manufacturing Survey, including methodologies and the latest report, click here.
| Empire State Manufacturing Survey | April | Mar | April '05 | 2005 | 2004 | 2003 |
|---|---|---|---|---|---|---|
| General Business Conditions (diffusion index) | 15.81 | 29.03 | 5.09 | 15.56 | 28.79 | 15.98 |
by Louise Curley April 17, 2006
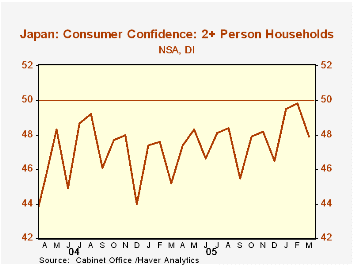
The March decline in consumer confidence among Japanese households is, in all likelihood, a non event. Confidence among Japanese households of two or more persons on a non seasonally adjusted basis (the headline measure) fell from 49.8 in February to 47.9 in March.However, the monthly series, which has been in existence only since April 2004, has consistently shown a decline in the last month of each quarter as shown in the first chart. Seasonally adjusted data are available only on a quarterly basis and are based on the unadjusted quarterly data going back to the second quarter of 1982. On this basis, confidence in the first quarter of 2006 was 48.2, up from 47.9 in the fourth quarter of 2005.
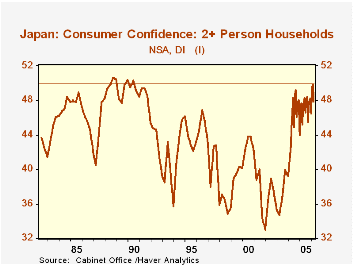 Confidence is measured by a diffusion index. Expected changes in confidence are rated as follows: better (1), slightly better (.75), the same (.50), slightly worse (.25) and worse (0). The index is a weighted average of the expected changes. The March value of the index at 47.9 implies that there are more households who are less confident that conditions will remain the same or become slightly worse than those who are confident that conditions will be the same or will improve.However, the level of the index is probably less important than its trend. During the entire time in which the index has been available it very rarely has been above the 50 level. This may or may not be an indication that Japanese households are always overly pessimistic. What is important is whether the households are becoming more or less confident. As the attached chart shows, the improvement in confidence that has taken place since the fourth quarter, 2001 low point of 33, has reached a point where it is now among the highest levels recorded. (In the attached chart, which includes the recent monthly data and the historical quarterly data, the latter have been smoothed by using the "interpolate" option under Tools.)
| Japan: | Mar 06 | Feb 06 | Jan 06 | Dec 05 | M/M % | 2004 | 2003 | 2002 |
|---|---|---|---|---|---|---|---|---|
| Consumer Confidence (2 or more person households, nsa) | 47.9 | 49.8 | 9.5 | 46.5 | -3.82 | 47.3 | 45.6 | 37.3 |
| Q1 06 | Q4 05 | Q1 05 | Q/Q % | Y/Y % | -- | -- | -- | |
| Consumer Confidence (2 or more person households, sa) | 48.2 | 42.9 | 45.5 | 12.3 | 5.9 | -- | -- | -- |

Tom Moeller
AuthorMore in Author Profile »Prior to joining Haver Analytics in 2000, Mr. Moeller worked as the Economist at Chancellor Capital Management from 1985 to 1999. There, he developed comprehensive economic forecasts and interpreted economic data for equity and fixed income portfolio managers. Also at Chancellor, Mr. Moeller worked as an equity analyst and was responsible for researching and rating companies in the economically sensitive automobile and housing industries for investment in Chancellor’s equity portfolio. Prior to joining Chancellor, Mr. Moeller was an Economist at Citibank from 1979 to 1984. He also analyzed pricing behavior in the metals industry for the Council on Wage and Price Stability in Washington, D.C. In 1999, Mr. Moeller received the award for most accurate forecast from the Forecasters' Club of New York. From 1990 to 1992 he was President of the New York Association for Business Economists. Mr. Moeller earned an M.B.A. in Finance from Fordham University, where he graduated in 1987. He holds a Bachelor of Arts in Economics from George Washington University.


