 Global| Apr 15 2005
Industrial Production Gain All Utilities
by:Tom Moeller
|in:Economy in Brief
Summary
Industrial production matched Consensus expectations and rose 0.3% in March following a downwardly revised 0.2% gain in February. The increase was due to cold weather which lifted utility output by 3.7% (5.0% y/y). Factory sector [...]
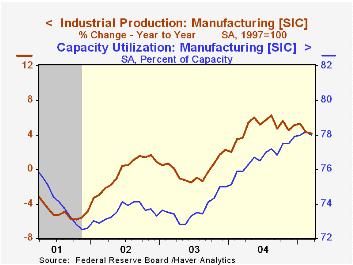
Industrial production matched Consensus expectations and rose 0.3% in March following a downwardly revised 0.2% gain in February. The increase was due to cold weather which lifted utility output by 3.7% (5.0% y/y).
Factory sector output fell 0.1% (+4.2% y/y) for the first decline since September. Excluding a 0.9% (20.0% y/y) rise in high tech sector output, manufacturing production fell 0.2% (+3.1% y/y).
Motor vehicle & parts led output lower and fell 3.6% (+2.1% y/y). Excluding both high tech & motor vehicles factory in March, output ticked up 0.1% (3.2% y/y). Output of furniture was unchanged (-0.7% y/y) but clothing output fell 1.9% (-10.0% y/y). Machinery output rose 0.5% (7.3% y/y) and production of electrical equipment, appliances & components rose 0.4% (4.0% y/y).
Total capacity utilization rose to 79.4% as capacity grew 1.2% y/y. Factory sector utilization fell to 78.0% and capacity rose 1.3% y/y.
Yesterday's speech by Federal Reserve Board Governor Donald L. Kohn on the Economic Outlook can be found here.
| Production & Capacity | Mar | Feb | Y/Y | 2004 | 2003 | 2002 |
|---|---|---|---|---|---|---|
| Industrial Production | 0.3% | 0.2% | 3.9% | 4.1% | -0.0% | -0.3% |
| Consumer Goods | -0.2% | 0.5% | 2.4% | 2.7% | 0.3% | 1.4% |
| Business Equipment | 0.2% | 0.2% | 8.7% | 9.5% | 1.2% | -7.9% |
| Capacity Utilization | 79.4% | 79.3% | 77.4% (03/04) | 78.1% | 75.5% | 75.3% |
by Tom Moeller April 15, 2005
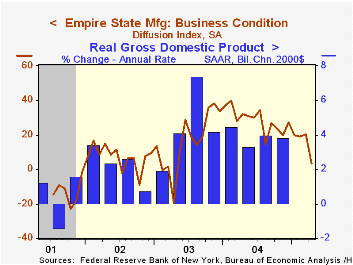
The April Empire State Index of General Business Conditions in New York's manufacturing industries dropped sharply 3.12 from an upwardly revised March level. The decline was to the lowest level since 2003.
The new orders component went negative for the first time in two years and the shipments index was barely positive. Employment fell as well and the measure indicated little if any job growth. Like the Philadelphia Fed Index of General Business Conditions, the Empire State Business Conditions Index reflects answers to an independent survey question; it is not a weighted combination of the components.
The prices paid index fell sharply to the lowest level in over a year.
Expectations for business conditions in six months fell sharply. The decline reversed the prior month's improvement and indicated the most pessimism since 2001. Expectations for future capital spending held up relatively well and slipped m/m to the average level of 2004 which was sharply improved from the year earlier. 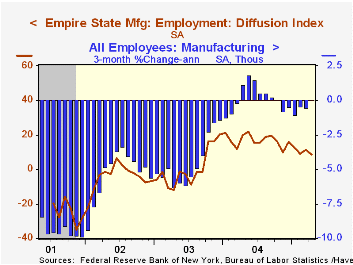
The Empire State Manufacturing Survey is a monthly survey of manufacturers in New York State conducted by the Federal Reserve Bank of New York. Participants from across the state in a variety of industries respond to a questionnaire and report the change in a variety of indicators from the previous month. Respondents also state the likely direction of these same indicators six months ahead. April 2002 is the first report, although survey data date back to July 2001.
For more on the Empire State Manufacturing Survey, including methodologies and the latest report, click here.
| Empire State Manufacturing Survey | April | Mar | April '04 | 2004 | 2003 | 2002 |
|---|---|---|---|---|---|---|
| General Business Conditions (diffusion index) | 3.12 | 20.18 | 32.16 | 28.76 | 16.17 | 7.19 |
by Tom Moeller April 15, 2005
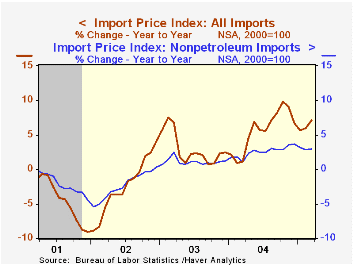
The 1.8% rise in import prices last month greatly exceeded Consensus expectations for a 1.3% increase and the prior month's gain was revised up.
Petroleum prices jumped 10.6% m/m and pulled prices one third higher than last year, but relief may be in store. So far in April the price of Brent Crude oil has run below the March average of $53.13 per barrel and yesterday touched $49.79.
Import prices outside of petroleum posted a 0.3% rise in March that mostly reflected a 3.4% (9.7% y/y) gain in prices of foods & beverages but prices for industrial supplies & materials less petroleum also posted a strong 1.1% (11.1% y/y) spike.
Prices for non-auto consumer goods fell 0.4% (+1.0% y/y) and capital goods prices slipped another 0.1% (-0.9% y/y). Excluding computers capital goods prices were unchanged (2.3% y/y). Imported computer prices fell 0.5% (-7.2% y/y).
Export prices jumped 0.7% last month as agricultural prices surged 3.7% (-8.1% y/y) and nonagricultural export prices rose 0.4% (4.6% y/y).
| Import/Export Prices (NSA) | Mar | Feb | Y/Y | 2004 | 2003 | 2002 |
|---|---|---|---|---|---|---|
| Import - All Commodities | 1.8% | 0.8% | 7.1% | 5.6% | 2.9% | -2.5% |
| Petroleum | 10.6% | 4.6% | 36.1% | 30.5% | 21.0% | 3.0% |
| Non-petroleum | 0.3% | 0.1% | 2.9% | 2.6% | 1.1% | -2.4% |
| Export - All Commodities | 0.7% | 0.0% | 3.3% | 3.9% | 1.6% | -1.0% |
by Tom Moeller April 15, 2005
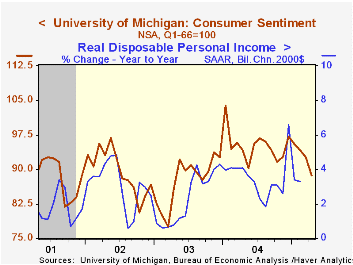
The University of Michigan's preliminary reading of consumer sentiment in April fell 4.2%. The m/m decline was the largest since last May, was much deeper than Consensus expectations for a more moderate decline and pulled Sentiment to its lowest level in nearly two years.
Sentiment has fallen in each of the last four months and is off 14.5% from the January '04 peak. During the last ten years there has been a 75% (inverse) correlation between the level of consumer sentiment and the unemployment rate.
Consumer expectations fell a hard 4.6%. Down for the fourth straight month the figure is off 21.1% from the January '04 high. The expected change in real family income fell 12.2% to the lowest level since 1991. More unemployment was expected by the highest percentage since late 2003 and price inflation was expected to quicken.
The reading of current economic conditions fell 3.8% for the third consecutive monthly decline and the latest is off 5.1% from the 2004 peak. Fewer thought now was a good time for buying vehicles and fewer thought now was a good time for buying houses.
The University of Michigan survey is not seasonally adjusted.The mid-month survey is based on telephone interviews with 250 households nationwide on personal finances and business and buying conditions. The survey is expanded to a total of 500 interviews at month end.
| University of Michigan | April | Mar | Y/Y | 2004 | 2003 | 2002 |
|---|---|---|---|---|---|---|
| Consumer Sentiment | 88.7 | 92.6 | -5.8% | 95.2 | 87.6 | 89.6 |
| Current Conditions | 103.9 | 108.0 | -1.0% | 105.6 | 97.2 | 97.5 |
| Consumer Expectations | 79.0 | 82.8 | -9.5% | 88.5 | 81.4 | 84.6 |
by Carol Stone April 15, 2005
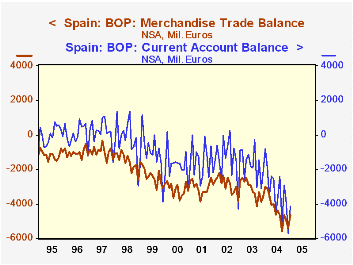
Spain's current account deteriorated significantly during 2004, and in January, which was reported today by the Bank of Spain, the deficit continued to widen from year-earlier amounts (see graph alongside).
Much of this movement occurred in merchandise trade, as might be expected. However, other current accounts also moved adversely, as evidenced in the table below. The surplus on services decreased, and the deficit on income increased considerably. Among services, the surplus on tourism, which rose from the mid-1990s through the middle of 2001, flattened subsequently, and during the last year it diminished as Spaniards traveled elsewhere, while outlays by tourists to Spain just held steady.
Conventional wisdom argues that the function of the financial accounts in the balance of payments is to "finance" the current account. But increasingly, as we have frequently mentioned for the US, the financial accounts evolve autonomously. For example, direct investment into Spain, which ran surpluses in 2002 and 2003, moved decisively into deficit last year.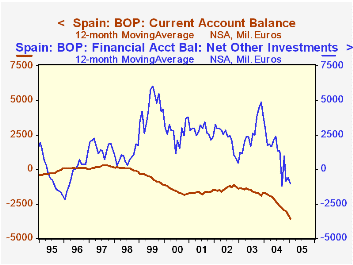
Similarly with "other" investment, representing mainly bank deposit and lending activities, a surplus in the two earlier years shifted to a deficit position for 2004 and this continued in January. This last item in particular might be associated with the financial operations that facilitate trade flows. But it moved against the trade flows instead. Portfolio investment and payments through the Bank of Spain made the difference to "balance" the "balance of payments". This mix of payment types, however, highlights clearly that financial flows exert their own independent impact on international economic relations, serving a broader function than simply offsetting shipments of goods back and forth across national borders.
| SPAIN Balances, Mil. Euros |
Jan 2005 | Dec 2004 | Jan 2004 | Monthly Averages|||
|---|---|---|---|---|---|---|
| 2004 | 2003 | 2002 | ||||
| Current Account | -4155 | -5710 | -809 | -3295 | -1736 | -1407 |
| Merchandise | -4675 | -5403 | -2989 | -4324 | -3154 | -2884 |
| Services | 1431 | 1236 | 1292 | 2097 | 2272 | 2215 |
| Income | -1223 | -1715 | -640 | -1069 | -882 | -940 |
| Financial Account | 4680 | 3919 | 1673 | 3027 | 1470 | 1230 |
| "Private" Financial Flows = Sum of 3 Below | 3022 | 1072 | 8738 | 4040 | 1618 | 1342 |
| Direct Investment | -1170 | -1526 | -326 | -2157 | 166 | 389 |
| Portfolio Investment | 7861 | 8479 | 7597 | 6798 | -2506 | 474 |
| Other Investment | -3669 | -5881 | 1467 | -601 | 3958 | 479 |

Tom Moeller
AuthorMore in Author Profile »Prior to joining Haver Analytics in 2000, Mr. Moeller worked as the Economist at Chancellor Capital Management from 1985 to 1999. There, he developed comprehensive economic forecasts and interpreted economic data for equity and fixed income portfolio managers. Also at Chancellor, Mr. Moeller worked as an equity analyst and was responsible for researching and rating companies in the economically sensitive automobile and housing industries for investment in Chancellor’s equity portfolio. Prior to joining Chancellor, Mr. Moeller was an Economist at Citibank from 1979 to 1984. He also analyzed pricing behavior in the metals industry for the Council on Wage and Price Stability in Washington, D.C. In 1999, Mr. Moeller received the award for most accurate forecast from the Forecasters' Club of New York. From 1990 to 1992 he was President of the New York Association for Business Economists. Mr. Moeller earned an M.B.A. in Finance from Fordham University, where he graduated in 1987. He holds a Bachelor of Arts in Economics from George Washington University.
More Economy in Brief


