 Global| Feb 17 2010
Industrial Output Firms
by:Tom Moeller
|in:Economy in Brief
Summary
With a 0.9% January increase, U.S. industrial output posted its strongest monthly gain since August. Moreover, the run-up since the June bottom has totaled 5.3%. That compares with a 13.2% decline during the prior year which exceeded [...]
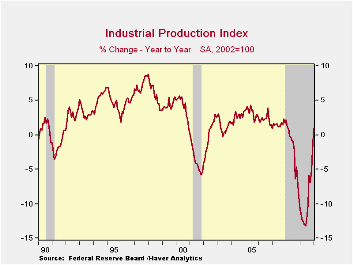 With a 0.9%
January increase, U.S. industrial output posted its strongest monthly
gain since August. Moreover, the run-up since the June bottom has
totaled 5.3%. That compares with a 13.2% decline during the prior year
which exceeded the declines during most other postwar recessions.
With a 0.9%
January increase, U.S. industrial output posted its strongest monthly
gain since August. Moreover, the run-up since the June bottom has
totaled 5.3%. That compares with a 13.2% decline during the prior year
which exceeded the declines during most other postwar recessions.
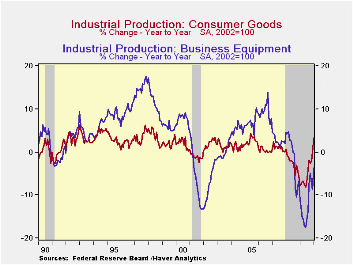
A 1.1% increase in the output of consumer goods paced the January production increase. The y/y gain of 3.2% has been driven by a nearly one-half increase in auto products output during the last year. Output of computers, video & audio output also rose 1.0% (-5.3% y/y) for the fifth consecutive strong monthly gain. Output of appliances, furniture & carpeting was unchanged last month (-7.5% y/y) after a sharp December fall which was part of an 18.1% 2009 drop. Business equipment output was strong for the second consecutive month but still was off 3.7% y/y after the 12.5% decline during all of last year. Finally, apparel output jumped 3.4% last month (0.7% y/y) and since its bottom has risen 5.9%.
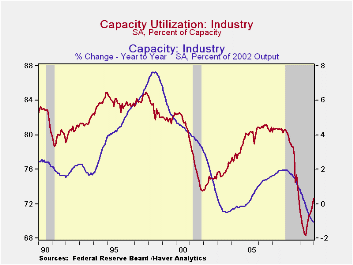
Capacity utilization rose further to 72.67%, its highest level since December 2008. In the factory sector alone utilization rose to 69.4% from the 2009 low of 65.2%. Utilization in the primary metals area has risen sharply to 61.9% from a 2009 average of 51.2% with the rebound in output. There's also been rise in utilization in the motor vehicle sector to 55.0% from a low of 36.8% in June. Utilization was 77.0% in 2005. The rise in utilization was accompanied by another 0.1% m/m decline in capacity which was off a record 1.1%y/y.
The industrial production data are available in Haver's USECON database.
Using FOMC Forecasts to Forecast the Economy from the Federal Reserve Bank of St. Louis can be found here.
| Industrial Production (SA,%) | January | December | November | Y/Y | 2009 | 2008 | 2007 |
|---|---|---|---|---|---|---|---|
| Total Output | 0.9 | 0.7 | 0.6 | 1.0 | -9.7 | -2.2 | 1.5 |
| Manufacturing | 0.9 | 0.0 | 0.9 | 1.6 | -11.3 | -3.2 | 1.4 |
| Consumer Goods | 1.1 | 0.7 | -0.3 | 3.2 | -5.2 | -2.6 | 0.9 |
| Business Equipment | 1.0 | 1.3 | -0.3 | -3.7 | -12.5 | -1.1 | 2.7 |
| Construction Supplies | 0.9 | -1.7 | 1.6 | -5.4 | -17.6 | -6.3 | -2.0 |
| Materials | 0.8 | 0.5 | 1.3 | 2.0 | -10.9 | -1.9 | 2.0 |
| Utilities | 0.7 | 6.3 | -3.0 | -0.5 | -2.6 | 0.3 | 3.4 |
| Capacity Utilization (%) | 72.6 | 71.9 | 71.3 | 71.1 (Jan. '09) | 70.1 | 77.5 | 80.6 |

Tom Moeller
AuthorMore in Author Profile »Prior to joining Haver Analytics in 2000, Mr. Moeller worked as the Economist at Chancellor Capital Management from 1985 to 1999. There, he developed comprehensive economic forecasts and interpreted economic data for equity and fixed income portfolio managers. Also at Chancellor, Mr. Moeller worked as an equity analyst and was responsible for researching and rating companies in the economically sensitive automobile and housing industries for investment in Chancellor’s equity portfolio. Prior to joining Chancellor, Mr. Moeller was an Economist at Citibank from 1979 to 1984. He also analyzed pricing behavior in the metals industry for the Council on Wage and Price Stability in Washington, D.C. In 1999, Mr. Moeller received the award for most accurate forecast from the Forecasters' Club of New York. From 1990 to 1992 he was President of the New York Association for Business Economists. Mr. Moeller earned an M.B.A. in Finance from Fordham University, where he graduated in 1987. He holds a Bachelor of Arts in Economics from George Washington University.
More Economy in Brief


