 Global| Mar 14 2002
Import Prices Resume Their Slide
by:Tom Moeller
|in:Economy in Brief
Summary
Prices for imported commodities were weaker than expected last month, falling rather than rising 0.2% as expected by Consensus estimates. Nonpetroleum import prices fell for the twelfth month in thirteen. Prices of capital goods and [...]
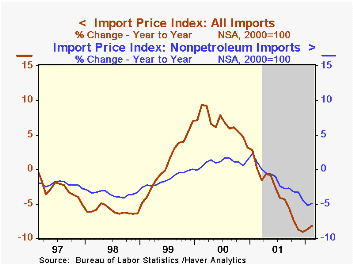
Prices for imported commodities were weaker than expected last month, falling rather than rising 0.2% as expected by Consensus estimates.
Nonpetroleum import prices fell for the twelfth month in thirteen. Prices of capital goods and nonauto consumer goods continued slides that began in 1995. Imported food prices more than reversed a January run-up.
Petroleum import prices rose for the second month in a row and Brent crude oil prices are up further in March.
Export prices fell for the twelfth month in thirteen.
| Import/Export Prices (NSA) | Feb | Jan | Y/Y | 2001 | 2000 | 1999 |
|---|---|---|---|---|---|---|
| Import - All Commodities | -0.1% | 0.4% | -8.3% | -3.5% | 6.5% | 0.9% |
| Petroleum | 2.9% | 5.3% | -30.4% | -17.2% | 66.5% | 34.2% |
| Nonpetroleum | -0.5% | 0.1% | -5.0% | -1.5% | 1.0% | -1.4% |
| Export - All Commodities | -0.2% | -0.1% | -2.9% | -0.8% | 1.6% | -1.3% |
by Tom Moeller March 14, 2002
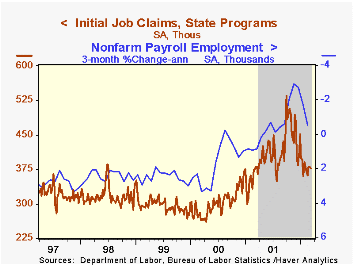
Initial claims for unemployment insurance fell slightly less than expected in the latest week. The prior week's level was revised up from 376,000. Claims are up slightly versus February.
The chart indicates an 82% correlation between the level of initial claims and the 3-month change in nonfarm payrolls.
The four-week moving average of claims rose to 374,750.
Continuing claims for unemployment insurance rose sharply in the latest week but the prior week's level was revised down substantially.
The insured rate of unemployment rose slightly to 2.7%, about where it's been all year.
| Unemployment Insurance (000s) | 03/09/02 | 03/02/02 | Y/Y | 2001 | 2000 | 1999 |
|---|---|---|---|---|---|---|
| Initial Claims | 377.0 | 380.0 | -0.8% | 408.0 | 302.8 | 297.7 |
| Continuing Claims | -- | 3,479 | 40.3% | 3,031 | 2,127 | 2,187 |
by Tom Moeller March 14, 2002
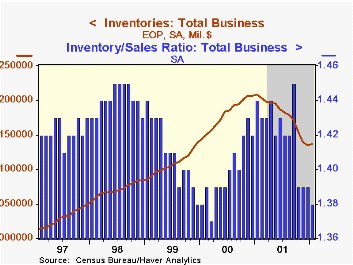
Total business inventories rose in January for the first time since January '01 versus expectations for a slight decline. The decline in December inventories was little revised.
Nonauto retail inventories, the new news in today's report, rose for the first time since last August led by sharp increases in apparel and furniture.
Inventories of motor vehicles & parts also rose sharply, the second consecutive monthly gain following three months of decline.
Overall business sales surged 1.1% (-1.9% y/y) following no change in December. Higher sales by merchant wholesalers and manufacturers led the rise.
The inventory-to-sales ratio fell to 1.38, down from 1.42 for all of last year.
| Business Inventories | Jan '02 | Dec '01 | Y/Y | 2001 | 2000 | 1999 |
|---|---|---|---|---|---|---|
| Total | 0.2% | -0.5% | -6.0% | -6.0% | 6.0% | 5.0% |
| Retail | 1.4% | 0.1% | -3.8% | -4.7% | 6.8% | 7.6% |
| Retail excl. Autos | 0.6% | -0.1% | -1.3% | -1.8% | 4.4% | 5.5% |
| Wholesale | -0.2% | -0.5% | -5.1% | -5.3% | 7.1% | 6.1% |
| Manufacturing | -0.6% | -0.9% | -8.4% | -7.5% | 4.6% | 2.3% |
by Tom Moeller March 14, 2002
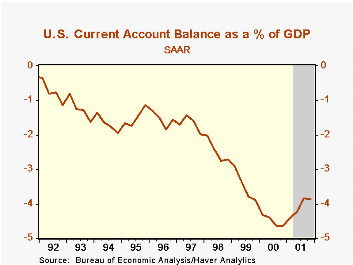
The US current account deficit deepened slightly last quarter following steady improvement during the prior year.
A deeper deficit on unilateral transfers caused the deterioration in the current account. The deficit on goods, services and income improved slightly.
In percentage terms, exports of goods and services fell more than imports, but the deficit nevertheless improved because imports are so much larger than exports.
| US Int'l Balance of Payments | 4Q '01 | 3Q '01 | Y/Y | 2001 | 2000 | 1999 |
|---|---|---|---|---|---|---|
| Current Account Deficit | $98.8B | $98.5B | $116.3B | $417.4B | $444.7B | $324.4B |
| % of GDP | 3.9% | 3.9% | 4.6% | 4.1% | 4.5% | 3.5% |
| Deficit on Gds, Serv & Income | $85.0B | $85.9B | $100.0B | $366.9B | $390.5B | $275.5B |
| Exports | -5.2% | -7.0% | -18.3% | -8.5% | 14.2% | 4.3% |
| Imports | -4.3% | -7.7% | -17.5% | -7.9% | 19.2% | 11.2% |
| Unilateral Transfers Deficit | $13.9B | $12.7B | $16.7B | $50.5B | $54.1B | $48.9B |

Tom Moeller
AuthorMore in Author Profile »Prior to joining Haver Analytics in 2000, Mr. Moeller worked as the Economist at Chancellor Capital Management from 1985 to 1999. There, he developed comprehensive economic forecasts and interpreted economic data for equity and fixed income portfolio managers. Also at Chancellor, Mr. Moeller worked as an equity analyst and was responsible for researching and rating companies in the economically sensitive automobile and housing industries for investment in Chancellor’s equity portfolio. Prior to joining Chancellor, Mr. Moeller was an Economist at Citibank from 1979 to 1984. He also analyzed pricing behavior in the metals industry for the Council on Wage and Price Stability in Washington, D.C. In 1999, Mr. Moeller received the award for most accurate forecast from the Forecasters' Club of New York. From 1990 to 1992 he was President of the New York Association for Business Economists. Mr. Moeller earned an M.B.A. in Finance from Fordham University, where he graduated in 1987. He holds a Bachelor of Arts in Economics from George Washington University.
More Economy in Brief


