 Global| Jun 16 2004
Housing Starts Slipped
by:Tom Moeller
|in:Economy in Brief
Summary
Housing starts slipped 0.7%% last month from an upwardly revised level in April. May starts totaled 1.967Mversus the Consensus expectation for 1.95M. Single family starts rose 1.4% following the slight 0.4% April dip that was revised [...]
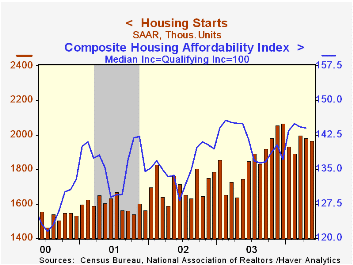
Housing starts slipped 0.7%% last month from an upwardly revised level in April. May starts totaled 1.967Mversus the Consensus expectation for 1.95M.
Single family starts rose 1.4% following the slight 0.4% April dip that was revised shallower. Single-family starts were down just 1.8% versus the record of November 2003.
Multi-family starts fell 9.9% following the revised 3.5% April drop.
The decline in housing starts last month was across the country's regions except the West where starts rose 28.9% to a record high following the 15.6% April slide.
Building permits rose 3.5% m/m to a record high.
| Housing Starts (000s, AR) | May | April | Y/Y | 2003 | 2002 | 2001 |
|---|---|---|---|---|---|---|
| Total | 1,967 | 1,981 | 12.5% | 1,848 | 1,711 | 1,601 |
| Single-family | 1,640 | 1,618 | 17.7% | 1,501 | 1,364 | 1,272 |
| Multi-family | 327 | 363 | -7.9% | 347 | 347 | 330 |
| Building Permits | 2,077 | 2,006 | 12.5% | 1,831 | 1,750 | 1,637 |
by Tom Moeller June 16, 2004
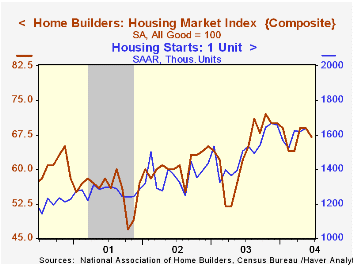
The Composite Housing Market Index reported by the National Association of Home Builders (NAHB) fell to 67 in June. The index nevertheless remained 8.1% higher than last year.
During the last fifteen years there has been an 80% correlation between the y/y change in the NAHB index and the change in single family housing starts.
The index of expected single family home sales in six months and the index of current sales both fell moderately.
Traffic of prospective buyers fell slightly (+10.6% y/y) from the much improved May level.
The NAHB index is a diffusion index based on a survey of builders. Readings above 50 signal that more builders view conditions as good than poor.
Visit the National Association of Home Builders using this link.
| Nat'l Association of Home Builders | June | May | June '03 | 2003 | 2002 | 2001 |
|---|---|---|---|---|---|---|
| Composite Housing Market Index | 67 | 69 | 62 | 64 | 61 | 56 |
by Tom Moeller June 16, 2004
Industrial production surged 1.1% last month following the 0.8% jump in April. Consensus expectations had been for a 0.6% rise.
Production in the factory sector rose 0.9% (6.4% y/y) on the heels of the 0.7% gain in April, again paced by strength in the tech sector.
Output in selected high-technology industries rose 3.5% m/m (30.0% y/y). Output of semiconductors jumped 4.0% (49.1% y/y) and output of computers & peripheral equipment rose 2.5% (27.2% y/y). Output of communications equipment added 3.4% (0.2% y/y), the first monthly increase January.
Excluding high-tech factory output surged 0.8% (+5.1% y/y). Output of motor vehicles & parts fell for the third straight month (+6.9% y/y) but machinery output surged 1.5% (11.9% y/y). Output of electrical equipment output ticked 0.3% higher (7.1% y/y) and furniture output advanced 0.6% (2.0% y/y). Non-durables output less energy rose 0.8% (+2.8% y/y).
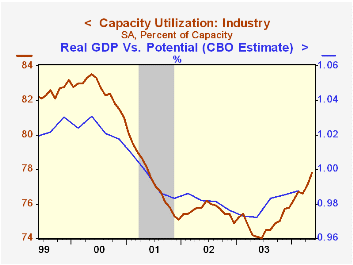
Total capacity utilization rose to 77.8%, the highest level since May '01. The rise since the low of 74.0% in June '03 reflects 6.3% growth in output and 1.1% growth in capacity.
| Production & Capacity | May | April | Y/Y | 2003 | 2002 | 2001 |
|---|---|---|---|---|---|---|
| Industrial Production | 1.1% | 0.8% | 6.2% | 0.3% | -0.6% | -3.4% |
| Capacity Utilization | 77.8% | 77.1% | 74.1%(5/03) | 74.8% | 75.6% | 77.4% |
by Tom Moeller June 16, 2004
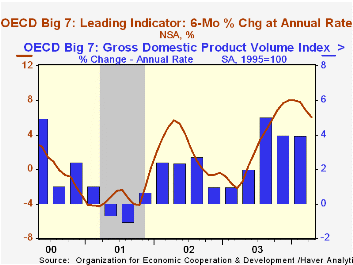
The Index of Leading Indicators for the Major Seven OECD Countries rose 0.3% in April but the prior month's gain was lowered to just 0.1%. Nevertheless, April marked the thirteenth consecutive monthly gain and y/y growth in the leaders of 7.5% is the highest since 1987 (6.1% 6-month growth, AR).
Leaders in Japan rose 0.3% but the advance read of a 0.6% rise in March was revised to no change, the second in a row. The six-month growth rate fell to 2.6%, slightly below the high.
The leading index for the European Union rose 0.2% following an unrevised 0.4% gain in March. The six month growth rate eased to 5.6%.
Leaders in Germany posted a 0.5% gain following an upwardly revised 0.4% March rise. The six-month growth rate was 7.2% versus the high of 9.0% in December. In France the leading index rose just 0.1% following an upwardly revised 0.2% March gain. The six-month growth rate eased to 6.7%. Leaders in the UK fell slightly for the second consecutive month. The six month growth rate fell to 3.1% from the high of 5.1% in February.
In Canada the leading index rose 0.2% but upward revisions to prior months lifted the six-month growth rate to 8.0%. Leading indicators in the United States rose 0.3% but March was revised to a slight decline. The six-month growth rate fell to 8.6% from its high of 12.2% in December.
Visit the OECD's website at this website.
| OECD Main Economic Indicators | April | Mar | Y/Y | 2003 | 2002 | 2001 |
|---|---|---|---|---|---|---|
| OECD Major Seven - Leading Index (Trend Restored) | 121.5 | 121.2 | 7.5% | 1.4% | 2.1% | -3.2% |
| European Union | 121.7 | 121.4 | 6.5% | 1.9% | 3.0% | -1.9% |
| Japan | 102.5 | 102.2 | 3.2% | 1.2% | -0.5% | -4.5% |
| United States | 134.0 | 133.5 | 10.6% | 1.7% | 2.5% | -3.6% |

Tom Moeller
AuthorMore in Author Profile »Prior to joining Haver Analytics in 2000, Mr. Moeller worked as the Economist at Chancellor Capital Management from 1985 to 1999. There, he developed comprehensive economic forecasts and interpreted economic data for equity and fixed income portfolio managers. Also at Chancellor, Mr. Moeller worked as an equity analyst and was responsible for researching and rating companies in the economically sensitive automobile and housing industries for investment in Chancellor’s equity portfolio. Prior to joining Chancellor, Mr. Moeller was an Economist at Citibank from 1979 to 1984. He also analyzed pricing behavior in the metals industry for the Council on Wage and Price Stability in Washington, D.C. In 1999, Mr. Moeller received the award for most accurate forecast from the Forecasters' Club of New York. From 1990 to 1992 he was President of the New York Association for Business Economists. Mr. Moeller earned an M.B.A. in Finance from Fordham University, where he graduated in 1987. He holds a Bachelor of Arts in Economics from George Washington University.
More Economy in Brief


