 Global| Feb 16 2006
Housing Starts Lifted By Mild Weather
by:Tom Moeller
|in:Economy in Brief
Summary
Housing starts jumped 14.5% m/m during January to 2.276M units, the highest since 1973, following a December decline which was revised shallower. New construction activity most certainly was aided by the record warm temperatures last [...]
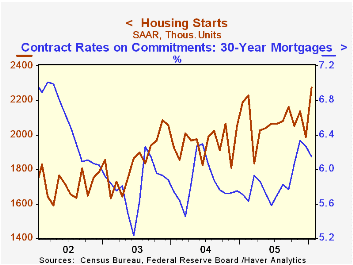
Housing starts jumped 14.5% m/m during January to 2.276M units, the highest since 1973, following a December decline which was revised shallower. New construction activity most certainly was aided by the record warm temperatures last month. Consensus expectations had been for a lesser rise to 2.02M starts.
A 12.8% spike in single-family starts to 1.819M, a new record, more than reversed a 10.5% decline during December. The benefit from mild weather was clear from the regional figures which indicated a 23.3% (21.4% y/y) surge in the Northeast and a 31.0% (19.6% y/y) gain in the Midwest. The continuing benefit from low mortgage interest rates also was evident as single family starts in the South rose 8.3% (-1.0% y/y) and in the West by 7.3% (-5.3% y/y).
Multi family starts also were helped by the warmth and jumped 21.9% m/m to a new record high. Building permits rounded out last month's strength with a 6.8% gain to the highest level since September.
Today's testimony of Chairman Ben S. Bernanke before the U.S. Senate Committee on Banking, Housing, and Urban Affairs was identical to yesterday's and is available here.
| Housing Starts (000s, AR) | Jan | Dec | Y/Y | 2005 | 2004 | 2003 |
|---|---|---|---|---|---|---|
| Total | 2,276 | 1,988 | 4.0% | 2,072 | 1,950 | 1,854 |
| Single-family | 1,819 | 1,613 | 2.8% | 1,716 | 1,604 | 1,505 |
| Multi-family | 457 | 375 | 9.1% | 355 | 345 | 349 |
| Building Permits | 2,217 | 2,075 | 3.8% | 2,122 | 2,058 | 1,8 88 |
by Tom Moeller February 16, 2006

In February, the National Association of Home Builders' (NAHB) Composite Housing Market Index remained at the depressed level of 57 for the third straight month. The figure compares to a high of 72 posted last June.
During the last twenty years there has been an 82% correlation between the y/y change in the annual composite index and the change in single family housing starts and there has been a 75% correlation between the current sales index and new single family home sales.
The January index for current sales of single family homes was stable at 62, down 20% from the January '05 level of 77. The index for sales in six months slipped to 65 from an upwardly revised 66 during January, but it averaged 75 last year.
Traffic of prospective home buyers remained quite depressed at an index level of 40, the lowest level since April 2003.
The NAHB index is a diffusion index based on a survey of builders. Readings above 50 signal that more builders view conditions as good than poor.
Visit the National Association of Home Builders.
| Nat'l Association of Home Builders | Feb | Jan | Feb '05 | 2005 | 2004 | 2003 |
|---|---|---|---|---|---|---|
| Composite Housing Market Index | 57 | 57 | 69 | 67 | 68 | 64 |
by Tom Moeller February 16, 2006

The import prices jumped 1.3% last month, the first m/m increase since October. Consensus expectations for a 1.0% increase.
Higher petroleum prices led the January strength in import prices with a 6.4% jump. Crude oil prices rose 8.0% (48.2% y/y) m/m but in February have reversed course. Yesterday's price for Brent Crude of $57.61 compared to a January average of $63.15 per bbl. and a December average of $57.03.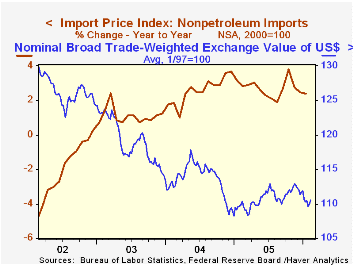
Nonpetroleum import prices rose 0.2% following and upwardly revised 0.1% December gain. The increase reflected a 1.2% (6.9% y/y) jump in foods, feeds & beverages. Prices for nonauto consumer goods also rose 0.2% (0.1% y/y) and capital goods prices fell 0.1% (-1.6% y/y). Excluding a 1.0% decline in computer prices (-6.6% y/y), capital goods prices rose 0.3% (0.8% y/y).
During the last ten years there has been a 66% (negative) correlation between the nominal trade-weighted exchange value of the US dollar vs. major currencies and the y/y change in non oil import prices. The correlation is a lower 47% against a broader basket of currencies and a lower 57% against the real value of the dollar.
Export prices jumped 0.7% led by a 1.7% (8.2% y/y) surge in industrial materials prices.
The Dollar U-Turn from the Federal Reserve Bank of St. Louis can be found here.
| Import/Export Prices (NSA) | Jan | Dec | Y/Y | 2005 | 2004 | 2003 |
|---|---|---|---|---|---|---|
| Import - All Commodities | 1.3% | -0.1% | 8.8% | 7.5% | 5.6% | 2.9% |
| Petroleum | 6.4% | -0.4% | 49.3% | 37.6% | 30.5% | 21.0% |
| Non-petroleum | 0.2% | 0.1% | 2.4% | 2.7% | 2.6% | 1.1% |
| Export - All Commodities | 0.7% | 0.1% | 2.7% | 3.2% | 3.9% | 1.6% |
by Tom Moeller February 16, 2006

Initial claims for jobless insurance rose 19,000 last week to 297,000, the highest level since early January. The prior week's increase was little revised so initial claims have been below 300,000 during six of the last seven weeks. Consensus expectations had been for an increase to 285,000 claims.
During the last ten years there has been a (negative) 75% correlation between the level of initial jobless insurance claims and the m/m change in payroll employment.
The four-week moving average of initial claims rose to 283,000 (-9.3% y/y).
Continuing unemployment insurance claims reversed most of the prior week's revised increase and fell 39,000.
The insured rate of unemployment remained at 2.0% for the second week.
| Unemployment Insurance (000s) | 02/11/06 | 02/04/06 | Y/Y | 2005 | 2004 | 2003 |
|---|---|---|---|---|---|---|
| Initial Claims | 297 | 278 | -3.6% | 332 | 343 | 402 |
| Continuing Claims | -- | 2,511 | -7.2% | 2,663 | 2,924 | 3,532 |
by Carol Stone February 16, 2006
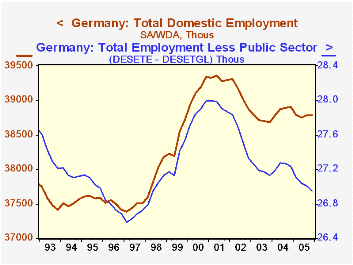
Germany's Federal Statistics Office reported Q4 employment data today, classified by industry. These data are an input to German GDP data, due for release next Wednesday, February 22.
Early last week (February 7), Louise Curley discussed here weakness in German industrial production for Q4 and sluggish wage performance for workers, already bringing a strike by one major union. Today's employment data give further evidence of weakening in the German economy. Total employment fell 5,000 in Q4 from Q3 and was off 0.3% from a year ago. Subtracting out government, education and other public service activities, we see that the private sector is even weaker. Jobs there decreased by 88,000 over the second half of 2005 and were off 1.0% from the year-ago period. They fell 0.8% for the year as a whole, while total employment was off 0.2% in 2005.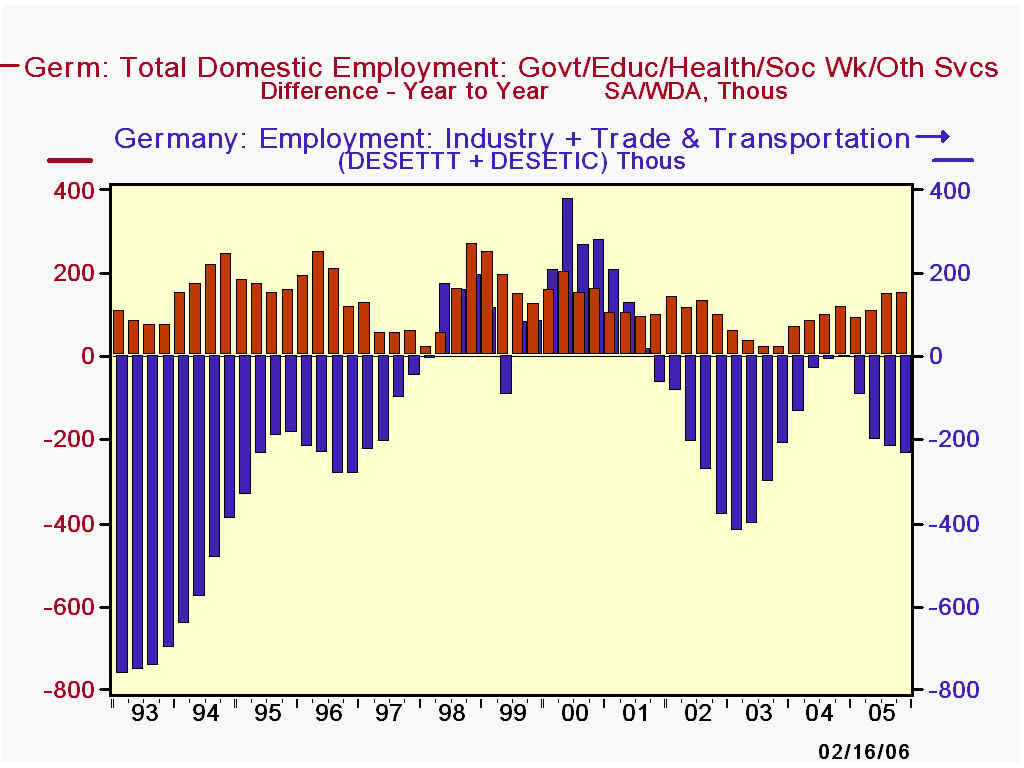
Jobs in industry declined 135,000 from Q4 2004 to Q4 2005 and the trade and transportation sector was down 102,000. Agriculture and construction employment also declined. Growth in finance and other business services, by contrast, showed a 76,000 increase across the year. Government and related jobs had a substantial 152,000 increase from Q4 2004. The sharp rise in public sector jobs clearly offset a good portion of the total 280,000 job loss in the private sector. At the same time, it increases the burden on private sector firms and workers to generate tax revenues with which to pay the public sector workers. So the support to the economy from added government workers comes with a cost to businesses, which are already weighed down with pressure from labor unions wanting greater compensation, as explained by Ms. Curley here last week.
| Germany ( SA*, Thousands) | Q4 2005 | Q3 2005 | Q4 2004 | 2005 | 2004 | 2003 |
|---|---|---|---|---|---|---|
| Total Domestic Employment** | 38,779 | 38,784 | 38,907 | 38,779 | 38,869 | 38,719 |
| Change | -5 | +29 | -0.3% | -0.2% | +0.4% | -1.0% |
| Industry | 7,844 | 7,864 | 7,979 | 7,882 | 8,018 | 8,138 |
| Trade*** | 9,709 | 9,735 | 9,811 | 9,737 | 9,791 | 9,716 |
| Finance & Business Services | 6,443 | 6,423 | 6,369 | 6,411 | 6,309 | 6,128 |
| Government/Education/Health/Etc | 11,826 | 11,779 | 11,676 | 11,753 | 11,628 | 11,535 |
| Change | +47 | +65 | +1.3% | +1.1% | +0.8% | +0.3% |
| Total - Government/Etc | 26,953 | 27,005 | 27,231 | 27,026 | 27,241 | 27,184 |
| Change | -52 | -36 | -1.0% | -0.8% | +0.2% | -1.5% |

Tom Moeller
AuthorMore in Author Profile »Prior to joining Haver Analytics in 2000, Mr. Moeller worked as the Economist at Chancellor Capital Management from 1985 to 1999. There, he developed comprehensive economic forecasts and interpreted economic data for equity and fixed income portfolio managers. Also at Chancellor, Mr. Moeller worked as an equity analyst and was responsible for researching and rating companies in the economically sensitive automobile and housing industries for investment in Chancellor’s equity portfolio. Prior to joining Chancellor, Mr. Moeller was an Economist at Citibank from 1979 to 1984. He also analyzed pricing behavior in the metals industry for the Council on Wage and Price Stability in Washington, D.C. In 1999, Mr. Moeller received the award for most accurate forecast from the Forecasters' Club of New York. From 1990 to 1992 he was President of the New York Association for Business Economists. Mr. Moeller earned an M.B.A. in Finance from Fordham University, where he graduated in 1987. He holds a Bachelor of Arts in Economics from George Washington University.
More Economy in Brief


